

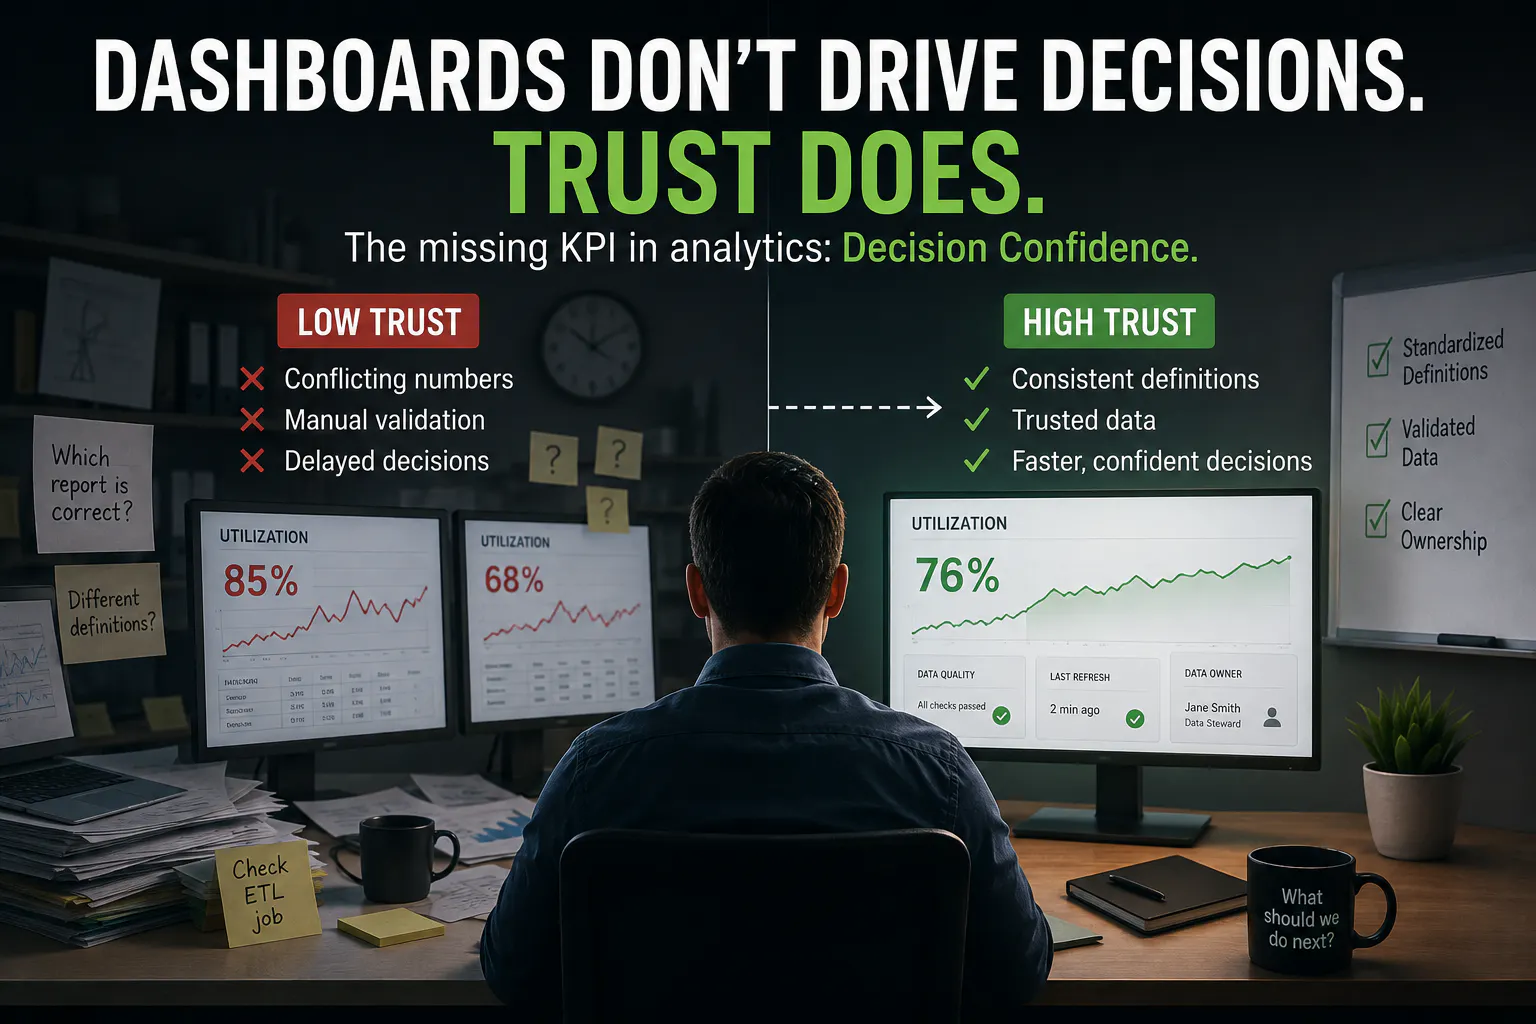
Your Dashboards Don’t Have a Data Problem. They Have a Trust Problem.
Why the most valuable analytics KPI isn’t dashboard adoption—it’s Decision Confidence.
Every organization wants to be data-driven.
The playbook usually looks the same: collect more data, build more dashboards, define more KPIs, and measure report usage.
It makes perfect sense on paper: when people need better decisions, give them more information
But after working on Business Intelligence and analytics initiatives across multiple organizations, I have noticed something that seemed different to me
You can build reliable data pipelines, modern dashboards, and near real-time reporting, yet business owners will still hesitate when it’s time to make an important decision. That may not be because of a lack of information, but it is caused by a lack of confidence in the information they are looking at
Over time, I realized that the biggest challenge in analytics is not about collecting more data. It is to get people to trust the data they already have.
Interestingly, this isn’t something I observed in projects. Industry research has repeatedly pointed out that becoming data-driven is as much a cultural challenge as it is a technology challenge. Organizations can invest heavily in analytics platforms and still struggle if people don’t consistently trust and use the information available to them.
The Meeting That Changed My Perspective
One meeting completely changed the way I think about analytics.
Operations leaders were reviewing weekly performance metrics when two departments presented reports that appeared to measure exactly the same thing. One report showed utilization at 85%, and another showed 68%.
Within minutes, the discussion stopped being about operational performance.
Analysts started explaining SQL logic. Engineers checked data pipelines.
Business users debated which calculation should be considered correct.
Nobody questioned the dashboards. They questioned the numbers.
That was neither a first nor a last meeting that is derailed by conflicting reports
Once I started paying attention, I realized the same pattern appeared in different organizations, different industries, and different analytics platforms.
The problem wasn’t a shortage of dashboards. The problem was a lack of trust in the data
The “More Dashboard” Trap
When business users ask for better insights, the response is often predictable.
“Let’s build another dashboard.”
Over time, that becomes a familiar cycle.
More data → More dashboards → More reports → More confusion
The assumption is understandable. More visibility should naturally lead to better decisions. But that’s rarely what happens.
Every new dashboard introduces another opportunity for inconsistent business logic unless everyone agrees on what the numbers actually mean.
I have seen organizations spend more time reconciling reports than discussing what those reports were supposed to help them decide. That is a hidden cost of analytics that rarely appears on any KPI dashboard.
When “Technically Correct” Isn’t Enough
One lesson analytics projects teach very quickly is that technically correct data is not always trusted data.
Imagine two departments measuring completed transactions.
The Sales team counts a transaction once a customer signs an agreement because that’s when commercial value is created. The Finance team counts the transaction only after settlement because that’s what financial reporting requires.
Neither team is wrong. Both are following legitimate business rules. But place those reports side by side during a review meeting and confidence immediately begins to disappear. The data isn’t inaccurate. The business definitions are inconsistent.
In my experience, these situations create far more confusion than software defects ever do. Most business users do not see SQL queries, ETL jobs, or transformation logic. They simply see two reports that disagree.
Once that happens, every future dashboard becomes a little harder to trust.
What Actually Improved Confidence
One of the most valuable lessons I learned came from an analytics modernization initiative where the team deliberately stopped asking:
“What new dashboard should we build?”
Instead, we asked a different question.
“Why don’t people trust the dashboards we already have?”
That shift completely changed our priorities. Instead of focusing on new reports and additional features, we focused on improving confidence in the existing ones.
Standardize Business Definitions
One of the biggest sources of confusion wasn’t bad data—it was different interpretations of the same metric.
Different dashboards maintained their own calculation logic, often created by different teams at different times.
The result was predictable. Every department believed its own numbers.
Centralizing important business calculations into a shared transformation layer significantly reduced those disagreements because everyone was working from the same business definitions instead of maintaining separate versions of the truth.
Validate Before Publishing
Another lesson!!!
Many discrepancies weren’t caused by incorrect data. They appeared during short windows when one upstream system had refreshed while another had not.
From an engineering perspective, everything was working exactly as designed. From a business perspective, the dashboards looked unreliable.
Adding automated validation checks before publishing data—and ensuring dependent datasets were synchronized—did far more to improve the trust than redesigning dashboards ever could.
Make Ownership Obvious
One of the simplest improvements turned out to be one of the most valuable. Every important business metric had a clearly identified owner. When users noticed an unexpected value, they immediately knew who could explain the calculation, validate the result, or investigate a potential issue.
Instead of questions bouncing between engineering, analytics, and business teams, they reached the right person much faster. Sometimes trust isn’t built through technology. Sometimes it’s built through accountability.
What the Best Engineering Organizations Understand
This challenge isn’t unique to traditional enterprises.
Some of the world’s largest technology companies have publicly shared similar lessons.
LinkedIn Engineering developed ThirdEye, a platform that continuously monitors business metrics and detects anomalies before they affect downstream decisions.
Uber Engineering has described a similar philosophy through Michelangelo. While it’s widely recognized as a machine learning platform, Uber has consistently emphasized the importance of standardized data pipelines, feature management, monitoring, and governance.
These companies aren’t investing in governance because dashboards are difficult to build.They’re investing because trustworthy decisions require trustworthy data.
We’re Measuring the Wrong KPI
Most analytics teams already measure operational health.
- Dashboard usage
- Query performance
- Pipeline execution
- Data refresh frequency
Those metrics matter.
But they don’t answer the question executives actually care about.
Can I confidently make a decision based on this report right now?
That’s the metric I believe organizations should pay much more attention to.I call it Decision Confidence.
Decision Confidence isn’t about how often people open a dashboard.
It’s about whether they trust what they’re seeing enough to act without opening a spreadsheet, emailing another department, or asking someone to verify the numbers.
Although most BI platforms don’t measure this directly, organizations can observe it by asking practical questions.
- How much meeting time is spent validating reports instead of discussing actions?
- How often do business users maintain their own spreadsheets instead of relying on enterprise dashboards?
- How frequently are important decisions delayed because different reports tell different stories?
- How quickly can teams explain unexpected changes in critical business metrics?
The answers reveal something dashboard adoption metrics never will.
Whether analytics is actually helping people make better decisions.
Trust Matters Even More in the AI Era
Generative AI is changing how organizations consume information. Stakeholders increasingly expect AI to summarize reports, identify trends, and recommend actions, which is exciting
But AI doesn’t solve inconsistent business definitions. If different departments calculate the same metric differently, AI simply summarizes inconsistent information faster. In other words, AI can accelerate decision-making, but it can’t create trust where trust doesn’t already exist.
Reliable AI begins with reliable data. Reliable data begins with shared definitions, governance, and confidence.
Conclusion
Looking back, the most successful analytics projects I’ve worked on weren’t the ones with the most sophisticated dashboards or the most impressive visualizations.
They were the ones where meetings stopped beginning with:
That’s a minor change. But it changes everything.
Data without trust is just noise. Dashboards that people hesitate to use are simply expensive reports.
Organizations don’t create value by building more dashboards. They create value by helping people make confident decisions. Maybe the most important analytics KPI is “decision confidence” rather than dashboard adoption
