

Newer on Bata India Ltd: Bata expands KRO network 2.6 times to 3,895 by Sep’26 →
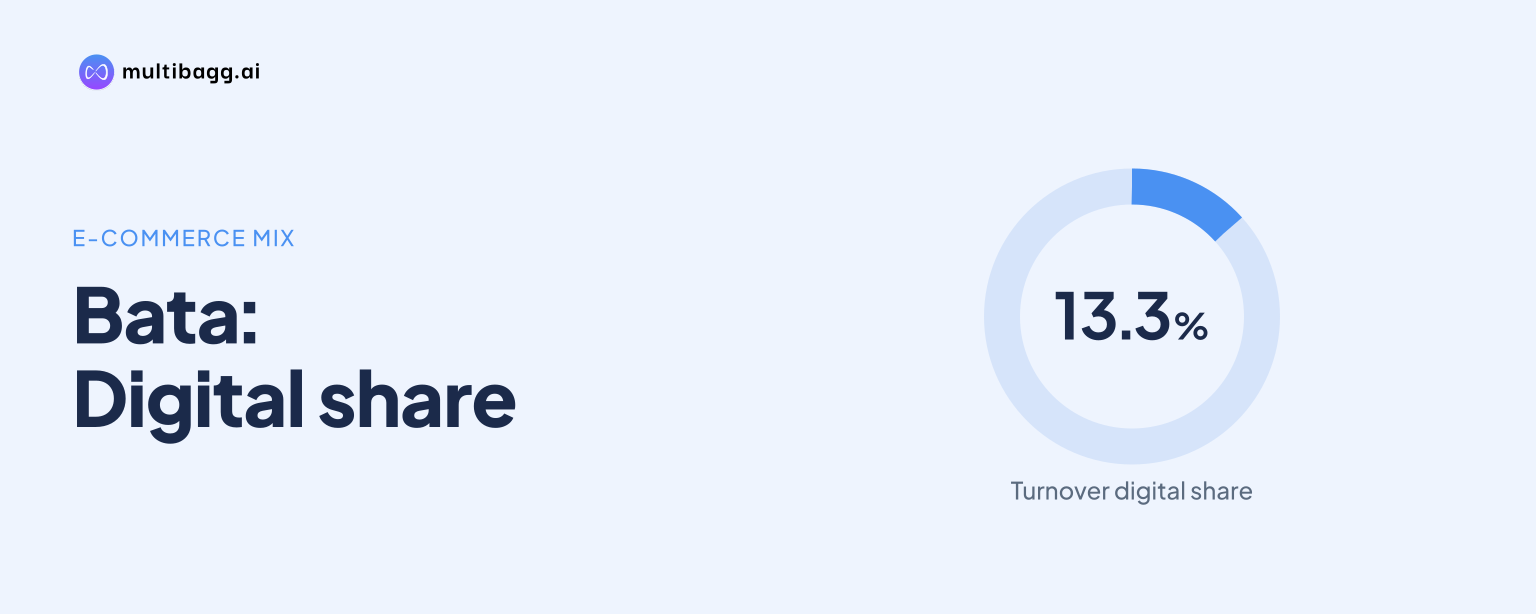
- Bata reported that its e-commerce digital channel accounted for 13.3% of turnover.
- Bata.com grew 26% versus last year, while total marketplace-plus-site e-commerce grew 5.4%.
- Bata’s mobile app surpassed 450,000 downloads and contributed about 14% of Bata.com business.
- Bata said 55% of home-delivery orders arrived within 48 hours, with about 1,800 pin codes serviceable for its three-hour model.

Bata reported that its e-commerce digital channel accounted for 13.3% of turnover, while Bata.com grew 26% versus last year, compared with 5.4% growth for total e-commerce. The presentation also records more than 450,000 app downloads and delivery within 48 hours for 55% of home-delivery orders.
Results, valuation, peers and who’s buying, in one view.
Bata reported that its e-commerce digital channel represented 13.3% of turnover. The company placed that measure in its OMNI, or home-delivery, update, linking digital sales with fulfilment rather than presenting it as a separate reported revenue amount.
The 13.3% figure is Bata’s clearest disclosed measure of digital scale because it is stated as a share of turnover. Bata did not disclose the turnover amount, the sales value <a href="https://bitcomme.com/chatgpt-now-lets-you-generate-gifs-2/” title=”ChatGPT now lets you generate GIFs”>generated through digital commerce, or a prior-period digital-turnover percentage, so the presentation does not show how the contribution changed over time.
Bata separately showed a digital-sales-contribution split of 57.6% for B2B, or business-to-business, 32.3% for B2C, or business-to-consumer, and 10.1% for Bata.in. The three categories total 100%, but Bata did not define the reporting period, revenue base or relationship of this chart to the 13.3% turnover measure.
| Digital sales contribution shown by Bata | Share |
|---|---|
| B2B | 57.6% |
| B2C | 32.3% |
| Bata.in | 10.1% |
The chart shows that B2B was the largest category at 57.6%, exceeding B2C by 25.3 percentage points and Bata.in by 47.5 percentage points. However, the presentation does not identify the customers, products or channels included in B2B and B2C, so these shares cannot be treated as individual contributions to Bata’s total turnover.
How fast is Bata.com growing compared with total e-commerce?
Bata.com grew 26% versus last year, while total e-commerce grew 5.4% versus last year. Bata defines total e-commerce as marketplace sales plus Bata.com, meaning the direct site is included in the combined e-commerce growth measure.
The 26% Bata.com growth rate was 20.6 percentage points above the 5.4% increase in total e-commerce. This is a comparison of reported rates, not of sales values: Bata did not disclose the value of website sales, marketplace sales, or the respective sales bases used to calculate the two growth rates.
Bata’s mobile app had more than 450,000 downloads and contributed about 14% of Bata.com business. The app is therefore a stated component of Bata.com activity, although the presentation does not give an app sales value, a download period, or a year-on-year comparison for downloads.
The presentation uses Bata.com for the 26% growth disclosure and Bata.in in the 10.1% digital-sales chart. Bata does not explain whether the two labels refer to the same digital property, different reporting labels, or separate digital components, so the figures should be read as separately disclosed measures.
What delivery capability supports Bata’s digital channel?
Bata said 55% of home-delivery orders were delivered within 48 hours. It also cited about 1,800 serviceable pin codes for its three-hour delivery model, providing separate measures of delivery speed and potential geographic reach.
The 55% measure covers orders delivered within 48 hours, while the 1,800-pin-code measure describes the three-hour model. Bata did not state what proportion of orders or pin codes qualified for three-hour delivery, so the two figures do not establish that 55% of orders arrived within three hours.
Bata also said Myntra’s MNow service was live through more than 300 stores. This gives the marketplace service a store-based fulfilment mechanism, but Bata did not disclose MNow order volumes, sales, delivery times, or its contribution to the 13.3% digital-turnover share.
The broader retail network provides context for the more than 300 MNow stores. Bata reported 2,043 DOS and franchise stores across 880 cities, while Karnataka had 276 stores, Maharashtra had 222 and Tamil Nadu had 202, the three largest state counts listed in the presentation.
How does digital expansion fit Bata’s operating plan?
Bata lists digital scale-up as one of five strategic commitments, alongside retail footprint expansion, distribution reach, progressive inventory decluttering and story-focused marketing. The 13.3% digital-turnover contribution and 26% Bata.com growth are disclosed within that wider operating plan.
Bata reported 15.8 million customers transacting annually through its retail network of 2,043 DOS and franchise stores. The presentation does not provide a store-versus-digital sales split, but the more than 300 MNow stores and the home-delivery disclosures show that stores are part of the stated digital fulfilment model.
Bata also reported changes in store inventory and product availability. Store clutter was shown at 0.71 times in Q2’27, compared with 0.75 times in Q2’26, while overall availability was 1.33 times in Q2’27 against a Q2’26 base of one time; Bata described availability as improving 18%.
Stock turns rose from 2.2 in Q2’26 to 2.6 in Q2’27, while full-price sales increased from 77% to 86%. Inventory was indexed at 0.74 times in Q2’27, versus 0.80 times in Q2’26 and 0.91 times in Q2’25, and Bata cited a 26% reduction against Q2’24.
Conclusion
Bata’s presentation shows that digital commerce accounted for 13.3% of turnover, with Bata.com growing 26% versus last year and faster than the 5.4% reported increase for total marketplace-plus-site e-commerce. App downloads of more than 450,000, a roughly 14% app contribution to Bata.com business, 55% of home-delivery orders delivered within 48 hours, and MNow operations through more than 300 stores describe the channel’s disclosed operating mechanisms.
The next stated milestone is Bata’s aim to take its KRO count beyond 5,000 by Q3’27, from 3,895 in Sep’26. Bata’s future disclosures on digital sales values, marketplace performance, app sales, and the share of orders eligible for three-hour delivery across about 1,800 serviceable pin codes would provide further detail on the channel’s development.
Frequently Asked Questions
Bata reported that its e-commerce digital channel accounted for 13.3% of turnover. The presentation does not disclose the turnover amount or the rupee value of digital sales behind that percentage.
Bata said Bata.com grew 26% versus last year. Total e-commerce, defined as marketplace sales plus Bata.com, grew 5.4% over the same comparison.
Bata reported more than 450,000 mobile-app downloads. It said the app contributes about 14% of Bata.com business, without disclosing an app sales value or a prior-year download figure.
Bata said 55% of home-delivery orders were delivered within 48 hours. It also reported about 1,800 serviceable pin codes for a three-hour model, but did not state how many orders qualify for that service.
Bata said Myntra’s MNow service was live through more than 300 stores. The presentation does not give MNow-specific sales, orders, delivery performance, or contribution to total digital turnover.
Did your stocks survive the war?
See what broke. See what stood.
