

Abstract
The integration of artificial intelligence (AI) into adaptive and autonomous systems announces a new era for Industry 5.0. The concept emphasizes human-centric, sustainable, and intelligent industrial processes. This study presents a comprehensive framework that combines supervised machine learning and generative modelling to predict and synthesize load types in industrial energy consumption data. A TinyML achieved a prediction accuracy of 95% in categorizing load types, such as light load, medium load, and maximum load, when compared to another ensemble model that achieved 94%, a GRU model at 82.8%, an LSTM with attention at 90.3%, and a traditional LSTM at 85.6%. Furthermore, a CTGAN-based tabular data generator was integrated to simulate realistic energy consumption patterns and facilitate advanced ‘what if’ analysis without the constraints of original data availability. The key features influencing load prediction included NSM, usage hours, and energy consumption. In comparison to the traditional deep learning model, the proposed work is lightweight because it utilizes a tiny machine learning model for load classification and employs a generative adversarial network to effectively define the CO2 emission rate and power consumption process within the industry, all while operating in a resource-constrained environment without requiring additional resources. This work highlights the crucial role of AI-driven autonomous systems in enhancing operational flexibility, promoting sustainability, and facilitating real-time human-AI collaboration in Industry 5.0 environments.
Subjects
Introduction
As industries evolve towards Industry 5.0, which involves the integration of human intelligence with artificial intelligence, this becomes fundamental in achieving more intelligent, adaptive, and sustainable manufacturing systems. Particularly, the GAI (generative artificial intelligence) offers many transformative capabilities, such as enabling systems not only to analyze existing data but also to generate new data, optimize operations dynamically, and create personalized solutions collaboratively with human operators. The need for AI in Industry 5.0 arises from the shift towards more human-centric and sustainable transformations in the industrial sector1. Industry 4.0 emphasizes automation and connectivity, leveraging IoT and robotics. However, Industry 5.0 aims to focus on collaboration between human and intelligent systems using GAI2. The tiny machine learning model can rapidly generate product designs by optimizing them for materials, cost, sustainability, and simulation performance. It enables production systems to create discrepancies of products on demand while maintaining the scale of profits.
Most industries are facing a significant challenge in the current day, which is the maintenance and repair issues with their machinery and tools. The AI can simulate and predict machine failures, suggesting optimal repairs and generating maintenance schedules based on real-time data. The tiny machine learning model can design numerous sustainable processes to reduce waste and suggest recycling for industrial derivatives. It can generate training content, immersive simulations, and knowledge bases for upskilling workers, specifically those valuable in ageing workforces or high-turnover industries3,4. The traditional Machine learning model can act as a black box, which makes it difficult for engineers and operators to trust and understand how the outputs are generated. Due to the lack of explainability, this creates a barrier in high-risk environments, such as manufacturing and production industries. While TinyML, CTGAN, and other generators create realistic-looking data, this ensures the statistical and functional validity for such critical applications. The synthetic data may introduce biases and artefacts that can affect downstream decisions5,6.
Most industrial applications are entirely dependent on legacy industrial infrastructures that are not capable of supporting advanced AI systems. However, the seamless integration and interoperability with existing tools and systems are very costly. The training and deployment of standard machine learning models can be resource-specific, and they may conflict with the primary goals of Industry 5.0. Additionally, Industry 4.0 highlights the collaborative work between humans and machines. However, current AI models lack contextual awareness and adaptability, which necessitate seamless interaction with human workers7. In industrial settings, such as steel industries, energy load predictions and optimizations are crucial for operational efficiency and reducing carbon footprints. Traditional systems have several limitations, including the use of historical data and rigid modelling structures8,9.
Additionally, when Industry 5.0 is integrated into intelligent systems, these models can help operators create proactive and adaptive load management systems10. This work mainly focuses on combining tiny machine learning algorithms with CTGAN. The tiny ML model can be used for classification, and CTGAN can be used for generating synthetic data. These approaches enhance the capability and adaptability that enable predictive analysis without overreliance on sensitive data, and support the core part of Industry 5.011.
The objective of this research uses Industry 5.0 that represents a human-centric, sustainable industrial model that influences the full potential of artificial intelligence for informed decision-making processes. This research proposes a lightweight Random Forest classifier, utilizing CTGAN, for resource-constrained devices to achieve an effective outcome in load prediction and classification of energy usage, CO2 emissions within an industrial ecosystem.
The main contribution of (1) this research is a lightweight random forest classifier (TinyML) as an intelligent classification system that can automatically identify three classes of industrial load (light, medium, and maximum) with 95% accuracy on an industrial load dataset. (2) A CTGAN is used for data augmentation, balancing load classes with KL divergence as 3.4%, MMD as 0.003, and distance correlations as 0.11, which ensure model fidelity. (3) After achieving fidelity, the proposed framework provides reproducibility through optimizer comparison, an ablation study on hyperparameters for statistical testing. (4) After conducting statistical tests, the condition used for testing and training with TinyML deployment measures flash size as 128 kb, RAM size as 44 kb, and latency as real-time deployment metrics. (5) Finally, the interpretation of feature importance, such as the hour of power usage and kilowatt-hours, is analyzed with suggestions for scheduling to achieve industry sustainability effectively.
The remaining sections of the research are organized as follows. Section 2 describes the literature survey of various load balancing methods, including their performance, advantages, and disadvantages. Section 3 describes the materials and techniques which are required for the proposed model. Section 4 presents the proposed methodology, which outlines the working principles of the proposed algorithms and their architecture. Section 5 describes the experimentation, results, and their analysis. The conclusion and future work are discussed in Sect. 6.
Literature review
At the forefront of Industry 5.0, manufacturing firms in developing countries face a unique confluence of challenges and opportunities. This exploratory study synthesizes recent literature to highlight both potential benefits and limitations. Nikhil Holsamudrkar et al.12 have analyzed the key benefits, which include personalized and interactive anomaly detection in machines. Additionally, they have developed formative assessments that provide feedback using a hybrid machine learning model. However, this work identified certain limitations, such as high computational overhead in training data. Ganguli, D et al.13 have found an emerging tool for the development of GAI. They have highlighted that the model should have important policy implications, which is the combination of predictable performance and unpredictable specific capabilities, such as input and output. Additionally, they have discussed the dual performance of the model, including higher-level predictability and apparent utility, which encourage development. Additionally, in their work on regulating AI systems, technologists are concerned about the societal issues associated with their work. They have understood that there are numerous funders for the use of AI and its versions in Industry 5.0 and migration efforts.
Katib, I et al.14 have explained the role of TinyML in managing the smart home appliances. Also, they have illustrated clearly the transformation from normal maintenance to predicative maintenance. In their work, they have discussed the various version of IoT devices and the methods which create these versions with real time monitoring. According to them, there are four major key attributes which enhance all these versions namely human centric, optimization, environmental sustainability and social sustainability. Also, they have discussed that how the raw material has converted as a successful IoT devices and chances of recycling of the same product. They have given many good ideas for improving economy of the organization using user friendly options using TinyML Driven Anomaly Detection.
Emil Njor et al.15 have designed a predictive maintenance using full stack machine learning model. The primary advantages of this architecture are active learning, forecasting and explainable AI. The authors have considered all the standards and provided holistic view to the TinyML architecture. The proposed architecture contains seven layers namely Data Visualization & Interaction layer, Data analytics layer, Data Protection layer, Data management layer, Cloud & high-performance computing layer, and user layer. They have validated the feasibility of the proposed method using real-world use cases like image and audio detection. The results which are obtained by the authors can be used in the manufacturing industries to achieve the goal.
Pai, A. et al. have presented a household appliances energy conception16. In this concept, the components of AI as TinyML based LSTM for automation and efficiency are utilized. They authors have integrated the environmental factors with augmented intelligence to provide strength of both humans and machines. In their work, they have given a brief survey of AI applications and challenges in energy prediction forecasting with an accuracy of 72.4%. They have discussed the various algorithms, methods and tools which are required for AI which enables the next generation intelligent systems to handle computational overhead.
Leng, J., Zhu et al.17 have analysed Industry 5.0 using industrial AI. The authors have used five key attributes to classify the industrial applications. The authors have implemented industrial AI with five levels: Shareable AI, Autonomous AI, Learnable AI, Knowledge AI, and Reactive AI. With this, industrial AI benefits from features such as collaborative intelligence, self-learning intelligence, crowd intelligence, human-centricity, sustainability, and resilience. The authors have designed an architecture that comprises hardware infrastructure, a computing engine, AI algorithms, empowering technologies, and industrial applications.
Zhang, E et al.18 has proposed an article which suggested the core concepts of methane analysis, using CTGAN. The author has understood that the tabular data of CTGAN not only enhance the prediction value but also introduces innovative, personalized reliability experiences. While the CTGAN provides many ways to achieve sustainable goals and gaining a competitive edge, it also presents the challenges having prediction accuracy range of 0.75 prone to overfitting towards large dataset. Huihui Lu et al.19 has discussed the technologies which enables the convolutional network model with its potential ways. The authors have discussed the key benefits of auto correlation and pervasive AI into the load prediction. The authors have discussed the additional features like additive manufacturing, hyper customization. According to the authors, the convLSTM has increased the prediction process carbon emission by 87% accuracy with other state of art models.
Jinxue Hu et al.20 have discussed the use of machine learning and big data analytics in electrical loads. The authors have employed a mamba attention analysis, which provides an excellent method for data extraction. The dataset extraction using this method can be done simultaneously in forecasting. The authors have elaborately discussed the sub-methods of local feature capture. According to them, the significant load signals create an additional load that has a substantial impact on the industrial environment, leading to production losses. However, with the use of generative artificial intelligence, this impact can be reduced compared to usual.
Chakir et al.21 have presented an ensemble-based machine learning algorithm for the Intelligent industrial automation system. The authors have proposed this algorithm to detect web-based attacks. Firstly, they have analyzed well-established machine learning algorithms for the user environment. Then, they have designed a homogeneous ensemble-based ML algorithm that performs well in maximum voting and stacking. For the data preprocessing, the authors have used a tokenization algorithm that can work on a versatile dataset. They have calculated performance metrics such as accuracy and F1 score, achieving 93.5% accuracy with the proposed model.
Pourmoradi, N et al.22 have presented method which gives a new approach on emergency load shedding. This method is completely depending upon the faults which are arises during user increase on certain environment. As the number of devices are increasing high, there is lack of load shedding of data. The authors tried to address this issue with the help of multi criteria decision making algorithm. This is CTGAN algorithm which will make it difficult to identify the sensitive data. By this way, they have uses graph network model for optimal load prediction and they have achieved good accuracy of 89% in the classification of load with latency as 1.25ms.
Mohammad Niyayesh & Yilmaz Uygun23 has presented a work which contains the advanced AI prediction algorithm on Feedforward network. The author has used machine learning algorithm and suggested automatic decision support system. The author has considered two real time examples for this study namely chemical gas emission and energy production. Here they use separate AI engines for both supervised and unsupervised learning to achieve higher accuracy. As his proposed model is self-adaptive, the decision support system has automated. With this proposed model, the research has achieved 92.5% accuracy.
Peruzzini, M., et al.24 have designed a framework for smart manufacturing based on human-automation association. They have proposed a model for intelligent manufacturing system design that contains a low-energy machine learning model. They have applied this model to smart manufacturing with various test cases. These test cases encompass a range of industries, including automated production lines, beverage packaging machines, tractor manufacturing lines, and collaborative assembly workstations. The proposed model consists of six layers: physical layer, communication layer, information layer, modelling layer, digital simulation layer, and AI-driven layer, as the model can incorporate digitization and real-time customer satisfaction.
Shkarupylo, V., et al.25 have proposed a model called a machine learning-assisted innovative production process. This model takes the support of AI, IoT, and augmented reality. The authors have designed a framework called Predictive Maintenance and Optimization using ML applications, which will enable intelligent decision-making. For predictive maintenance, the authors have used a convolutional neural network. For the performance evaluation, the authors have used an increased number of cycles, achieving 91% efficiency and 99% in vulnerability detection.
Ahmed T et al.26 have modelled a framework for smart manufacturing using the Bayesian-best worst method. In the first phase of this proposed model, the authors have attempted to find a solution using a TinyML. In the second phase, they have tried the best and worst methods, which may reveal the successful key parameters of Industry 5.0 smart manufacturing. With this proposed model, they have achieved 93.5% accuracy.
Research gap
Upon summarizing these literature reviews, certain deficiencies have been identified. The proposed methodology has been designed to address the identified deficiencies.
-
The synthetic dataset will be used to balance the model. The inclusion of a CTGAN-based model enables the balancing of load types in the industry environment.
-
The use of TinyML aids in activity recognition, environmental load sensing, and IoT processes; however, there is a lack of studies addressing the practical constraints of deploying ML models on microcontrollers in Industry 5.0.
-
Tracking of CO2 emissions at the device level remains weak.
With these research gaps, the proposed system should be designed to handle both original data and synthetic data. Additionally, it should efficiently classify the different types of loads using lightweight hardware devices.
Materials and methods
The prediction of energy load in the smart industry using a TinyML Classifier fused with CTGAN to analyze normal data and futuristic load balancing data, which includes CO2 emissions and three different load levels (low, medium, and high). The materials and methods for this study were carefully chosen to utilize real-time data on steel industry energy consumption. To avoid errors and achieve high efficiency, the proposed model is tested as follow.
Materials
Dataset description
The dataset comprises information on electricity consumption, stored in a cloud-based system. This industry information is stored on an industry electric power consumption website, and the data collection perspectives are daily, monthly, and annual27. The primary sources of the data are the steel industry. Table 1 highlights the attributes of the dataset28.
This data was collected from the UCI Machine Learning Repository, a well-known resource for machine learning tasks. It provides a variety of datasets which can be commonly used for machine learning and data mining applications. Additionally, they can be applied to classification, regression, clustering, time series analysis, natural language processing, and recommendation systems29. The key features of the dataset are open access, well-documented and a wide range of datasets.
Data preprocessing
Data preprocessing is a critical step in the machine learning pipeline. The raw data may be noisy, incomplete, unsuitable or inconsistent input to the models. The data preprocessing will transform this raw data into a structured way and improve the model performance30.
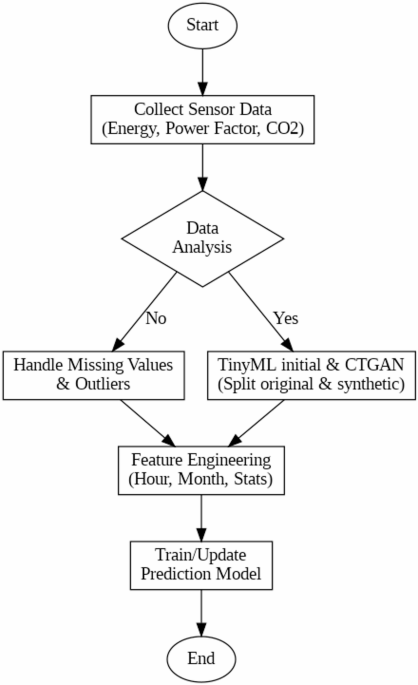
The primary step in data preprocessing is understanding the data and handling missing values. During the data understanding step, the model should inspect the dataset, check the column types and other distributions. Then it will identify the missing values and remove them based on domain relevance. The normalization of the numerical features will be calculated using the Min-Max scaler. The correlation analysis will be done using principal component analysis to reduce the dimensions and noise. Now, the dataset may have multiple binary features for different fault types. This can be used as binary targets for multi-class tasks. Figure 1 illustrates the steps of data preprocessing.
For the given dataset, assume the feature Hour = ExactHour(timestamp) and Month = ExactMonth(timestamp) then the number of seconds will be calculated as follows.
$$:NSM=Hour:times::3600+Minute:times:60+seconds$$
(1)
Like NSM, the labelled encoding of categorical variable can be given as
$$:Encodedleft(xright)=:left{begin{array}{c}0::,:if:x=Light:Load::::\:1:,:if:x=Medium:Load\:2,:if:x=Maximum:Loadend{array}right.$$
(2)
For any x value, the normalization using Min-Max scaling can be computed using
$$:{x}^{{prime:}}=frac{x-text{m}text{i}text{n}left(xright)}{text{max}left(xright)-text{min}left(xright)}$$
(3)
The extraction of hour and month from the timestamps are called as Datetime parsing. Also, the training and testing ratio has chosen as 70:30.
Proposed methodology
TinyML
TinyML primarily emphasizes low-power and low-constrained devices, such as embedded systems and microcontrollers, for high efficiency and output without any loss. The key advantages of these algorithms are low power consumption, On-Device Inference, small model sizes and real-time performance. TinyML will usually be designed with the support of ESP32 microcontrollers. With the help of these hardware arrangements, an Edge Impulse model can be constructed, which facilitates the easy deployment of models to microcontrollers31.
The process of TinyML involves training machine learning models on large and robust systems and deploying the models into optimized, compact versions to perform interpretation locally. Once the data are loaded into the pre-processed model, training will occur on-device using a powerful ML model. The trained model is compressed and optimized to fit the tiny devices32. The quantization, pruning, and knowledge distillation operations will occur during this period to reduce precision, remove unnecessary neurons, and share knowledge from the large model to the smaller model. The optimized model will be converted into a format suitable for microcontrollers. This will be implemented and analyzed using the Edge Impulse SDK method. Once the model is deployed, it runs directly on the device33. The classification will be done based on the given data. Assume, for the TinyML, decision tree constructions, the probability that sample i belongs to class c will be represented as follows.
$$:Pleft(c|{x}_{i}right)=:frac{1}{T}sum:_{t=1}^{T}{h}_{t}left({x}_{i}right)$$
(4)
Where T represents the number of decision trees and (:{h}_{t}) represents the prediction of tree t. The Gini impurity metric can be used to measure that how often a random element from the list may be incorrectly classified34. This factor can be used in the classifications to evaluate the performance. The Gini index can be calculated using the following expression.
$$:Gleft(tright)=1-:sum:_{i=1}^{C}{pleft(i|tright)}^{2}$$
(5)
Where C is the number of classes, p is the portion of class i of t. Information gain is the metric, which can be used in the decision trees to decide which feature to split at each and every step. The information gain will be calculated as
$$:IG=Gleft(Parentright)-:sum:_{j}frac{{N}_{j}}{N}Gleft(jright)$$
(6)
Here, j denotes the child node, N represents the number of samples at parent node, Nj represents samples at child node. The feature importance of the selected features can be calculated using
$$:Importance:left(fright)=:sum:_{t=1}^{T}sum:_{split:of:f}varDelta:Gleft(tright)$$
(7)
The prediction class will be calculated using the following expression.
$$:widehat{y}=text{arg}underset{c}{{max}}Pleft(c|xright)$$
(8)
TinyML deployment measurement analysis
The proposed model utilizes the TinyML pipeline for measurement analysis. Initially, the pruning is processed with the tree, where nodes with coverage less than 0.5 are pruned. The impurity is reduced by 1e-4, resulting in a 35% reduction in tree nodes while preserving accuracy. For resource-constrained devices, integer quantization is applied with an int16 threshold for linear mapping. For leaf prediction, the value is further quantized to int8 after minimum and maximum scaling. After the TinyML scaling, the ensemble of tabular-based CTGAN is exported with static C using microlegn with different leaf values, with an alignment of 12 bytes. Finally, the binary is flashed onto a device like the ESP-32 (WROOM-32), and the inference latency is measured using the esp-timer-get-time () library, which yields a value of 2.1ms. The flash size, which is a combination of TinyML and Runtime for 128KB, and RAM usage is 44KB, with the energy utilized by the model being around 0.36 mJ35,36.
Data generation using CTGAN model
The Conditional Tabular Generative Adversarial Networks (CTGAN) is a deep learning model which can be used for generating tabular data. CTGAN is a compelling model that utilizes datasets containing both continuous and categorical variables37. This method will yield good performance when the dataset is sensitive, imbalanced, or too small. As this method is dedicated to tabular data, it contains three primary parameters: generator, Discriminator, and Conditioning. The generator learns to produce synthetic samples which resemble the real data. The Discriminator will distinguish between real-time data and artificial data. The CTGAN uses the conditional generator to ensure the modelling of categorical variables. Additionally, it will facilitate learning the relationship between categorical and continuous features32,38.
The continuous features are transformed and normalized to capture multi-modal distributions. The CTGAN conditions the generator on specific values of categorical variables39,40. So, a conditional vector can be created during training that tells the generator to synthesize data for a specific category. This will ensure the generator to learn how categorical variables affect the distribution of the continuous one. The training process of the CTGAN involves the following five steps.
1. Sample a conditional vector – Choose a categorical column and one of its values.
2. Generator Input – Concatenate random noise vector with its conditional vector.
3. Generator Output – Produces a synthetic record that matches the conditioning.
4. Discriminator input – It takes real-time data or synthetic data with a conditional vector.
5. Loss or Optimization – It uses standard GAN loss to update both networks.
The primary advantages of the CTGAN are balanced learning across categorical data and it captures complex continuous distributions. The objective of the CTGAN can be defined using the following expression.
$$:{L}_{G}=:-{E}_{z sim p left(zright)}left[text{log}left(Dleft(Gleft(z|cright)right)right)right]$$
(9)
This function is otherwise called as CTGAN generator loss function. Further, the discriminator loss can be defined as
$$:{L}_{D}=-{E}_{xsim{p}_{real}}left[logDleft(x|cright)right]-{E}_{zsim pleft(zright)}left[text{log}left(1-Dleft(Gleft(z|cright)right)right)right]$$
(10)
In this expression, z is defined as sampling noise vector which is very important step that enables the generator to produce realistic and diverse synthetic tabular data. This can be expressed as follows.
$$:zsim Nleft(0,Iright)$$
(11)
Like sampling noise vector, the conditional sampling is also a key innovation which allows the model to generate the synthetic data. This will be conditioned on specific values and essential for tabular datasets. This will be expressed as follows.
$$:Pleft(z,cright)=Pleft(zright)pleft(cright)$$
(12)
Where c is the conditioning label like light load, medium load and maximum load. The output synthetic sample can be defined as
$$:stackrel{sim}{x}=Gleft(z|cright)$$
(13)
The final distribution matching between the real and synthetic data with respect to the feature f can be defined as
$$:{D}_{KL}({p}_{real}left(fright)left|right|{P}_{synthetic}left(fright)approx:0$$
(14)
Where DKL is the Kullback-Leibler divergence which should be minimum.
Architecture and working
The system merges TinyML with CTGAN to enable real-time, intelligent energy load classification in Industry 5.0, where humans and intelligent machines collaborate in smart and sustainable, decentralized industrial environments41,42. Figure 2 depicts the architecture of the proposed methodology.
Edge devices, such as ESP32 microcontrollers, will be used to support TinyML. Various sensors, including current, voltage, and power factor measurements, will be utilised for real-time energy load monitoring and classification. A lightweight machine learning model is deployed along with the controllers43,44. To address the limited labelled energy data in industrial environments, the CTGAN has been proposed as it will generate synthetic data45,46. The input of the CTGAN algorithm is real load data, such as power and current, and it produces an output as an expanded dataset with labelled synthetic samples. This will combine real and synthetic data to train the classifier. As TinyML has been used for classification, it will apply quantisation and pruning to make it compatible. This will be converted into a trained model and then flashed to an edge device with sensor integration. Now, the device is ready to run on-device inference to classify load types without relying on the cloud47.
Algorithm
Expermentation, results and analysis
The experiment was conducted to evaluate the effectiveness of combining TinyML and CTGAN for intelligent load classification in Industry 5.0. The primary goal of the study is to classify the electrical appliances based on their power usage patterns48. The CTGAN is used to enhance the accuracy of classification, while TinyML is utilized to deploy the trained model onto a microcontroller49.
Experimentation setup
The experimental setup was designed to build a robust smart load classification system capable of running microcontrollers using TinyML and CTGAN50. Table 2 contains the basic experimental setup for the proposed study.
Optimizer comparison
The proposed model is tested with different optimizers, which are fitted to produce the best tradeoff between high prediction accuracy and low training time. The paired t-test is performed between different optimizers, namely the Adam optimizer, the AdaGrad optimizer, and the RMSprop optimizer, under fixed settings of hyperparameters such as batch size (500) and epochs (10), with 5 different seeds. The results are expressed in Table 3, including the mean and standard deviation51.
Table 3 shows that the Adam optimizer’s performance on the paired test is below 0.01, compared to AdaGrad and RMSprop optimizers, which are 0.27 and 0.81, respectively. For this reason, the proposed model utilizes the Adam optimizer to produce effective results for different classes of load prediction on current and future CO2 emission functions, using a TinyML with CTGAN52.
Hyperparameter ablation study
The proposed model hyperparameter selection ablation test is conducted using a grid search with an estimator ε for different accuracy ranges, such as 50 to 500, depth as 4, 8, 12, and finally, batch size as 250, 500, and 1000. After the grid search process get over the proposed model classifier configuration for resource constrained devices run for 5 cross folds with different seed where final interface latency as 2.1ms for 100 estimators with max depth of 8, TinyML model size for micro controller as 128 kb with mean accuracy as 94.9% The results are expressed in Fig. 3, where the accuracy improvement after 100 trees as marginal towards 0.5% where the plateau arises after 200 trees for TinyML deployments.
Results analysis
Confusion matrix
The confusion matrix is used to evaluate the performance of the classification model by comparing the actual equipment classes and predicted classes51. The confusion matrix for this proposed work is plotted among light load, medium load, and heavy load, as illustrated in Fig. 4.
The figure is plotted based on the test dataset, which is evaluated after CTGAN and TinyML model quantization. The diagonal elements represent the correct classifications, whereas the off-diagonal elements are classified as incorrect classifications. The incorrect classifications are relatively low compared to the proper classifications.
Correlation heat map
The correlation heat map is used to visualize the linear relationship between different features in the dataset which are used for smart load classification. This will categorize the dataset into two categories namely strongly correlated features and weakly correlated features. This will be much helpful during feature selection and dimensionality reductions. The Fig. 5, depicts the correlation heat map of the proposed model.
The Fig. 5 illustrates the correlation heat map of the proposed methodology. This has been plotted among the important key attributes of the dataset like usage load, CO2, NSM, current, month, lagging and leading power factors. In the diagram, which is displayed as red are strongly correlated whereas which are indicated blue in colour are weakly correlated. The power usage with lagging current (reactive), power usage with CO2, lagging current (reactive) with CO2 and NSM with hour are strongly correlated. Likewise, leading current (reactive) with normal leading current is weakly correlated.
Performance metrics
The performance of the intelligent energy load classification system, utilizing TinyML and CTGAN, has been tailored for Industry 5.0, which can be attributed to three primary reasons. They are human-machine collaboration, decentralization and sustainability. The final performance of the model depends on the accuracy of the classifications. The accuracy of the classifications is given as.
$$:Accuracy=:frac{Number:of:correct:predictions}{Total:number:of:samples}$$
(15)
Usually, for any classifications the correct prediction and incorrect predictions of the samples will be termed as true positive (TP), true negative (TN), false positive (FP) and false negative (FN). Using these parameters, the performance metrics like precision, recall and F1-score will be calculated.
$$:Precision:left(cright)=:frac{{TP}_{c}}{{TP}_{c}+{FP}_{c}}$$
(16)
$$:Recall:left(cright)=:frac{{TP}_{c}}{{TP}_{c}+{FN}_{c}}$$
(17)
$$:F1left(cright)=2:times::frac{Precision:left(cright)times:Recall:left(cright)}{Precision:left(cright)+Recall:left(cright)}$$
(18)
From the precision, recall and F1-score values, the weighted average values can be calculated as follows.
$$:Weighted:precision=:sum:_{c=1}^{C}frac{{n}_{c}}{N}:times:precision:left(cright)$$
(19)
Where nc is the support of class c and N is the total samples.
$$:Weighted:Recall=sum:_{c=1}^{C}frac{{n}_{c}}{N}:times:recall:left(cright)$$
(20)
$$:Weighted:F1=:sum:_{c=1}^{C}frac{{n}_{c}}{N}:times:F1left(cright)$$
(21)
Model evaluation
The model evaluation represents the process of measuring performance metrics, such as accuracy, precision, recall, and F1-score, of the classification task. Figure 6 illustrates the model evaluation of the proposed study with convergence curve.
Figure 6 clearly illustrates that all performance metrics, including precision, recall, F1-score, and accuracy values, are consistently high (> 92% to 98%). With an accuracy of 95%, it indicates that the overall percentage of correct predictions is high. The convergence curve is occurred with downward trend towards 10th to 12th epoch which defines the model effectively learns and stable with different epochs. From the above result the model evaluation states that TinyML with CTGAN capable of separating multiple load condition with balanced precision, recall, F1-score, and accuracy over low, medium, high load categories.
Feature usage of load prediction
The top feature of this research is NSM, and hour both the functions are directly related to human work shift which is directly link towards the production cycle and industrial equipment on and off in innovative industry environments, these features are capture and fine grained as temporal structure for class like heavy load, light load and medium load starting from timeline of 6 AM to 10 PM. After the NSM, the hours of usage are considered another critical feature for the whole analysis of industrial equipment operation states. The plots define an increase in usage, showing the production hours. Based on usage, CO2 emissions are simultaneously analysed, which directly relate to the output attained during demand time. Production operation schedules are mapped as a feature necessary for predictive maintenance to predict load.
The Fig. 7 illustrates the top 10 important features for load prediction namely NSM, hour, usage, lagging current, month, CO2, lagging current (reactive), leading current, leading current (reactive) and weak status whereas the NSM features contribution towards the prediction is high and weak status is low in load prediction. This can support in the electrical appliance’s states like different loads. By enriching the training dataset with high quality synthetic samples, the TinyML and CTGAN helps in building more resilient and accurate load prediction models.
Data load distribution
The data load prediction refers to the statistical properties of the energy consumption data, such as light load, medium load, and maximum load. The TinyML algorithm is resource-constrained and requires statistical patterns to learn. The CTGAN is used to model and augment imbalanced data distributions. It will understand the distribution of tabular data and generate synthetic samples to imbalance. Figure 8 shows the data load distribution.
From this figure, it’s clearly observed that the original data load distribution and synthetic data load predictions for the light, medium and maximum load are optimal and distributed wisely. This is based upon the time and electrical appliance type. It reflects the original and synthetic distribution compactly because its primary goal is to predict across all load levels and devices.
The energy usages
From Fig. 9, it is observed that the medium load optimization is processed with four batching processes, namely (a) staggering start, which minimizes the continuous medium load start by 6.2% of peak load lowered by 2 h of CTGAN. (b) Time shifting, which processes off-peak hours monitored by the proposed model, which issues no-critical batch shifts. (c) operator alerts for medium load, which is off the production schedule. (d) automated control, which alerts to emissions and maximum load as real-time constraints.
Figure 9a illustrates the energy usage on weekdays and weekends, while Fig. 9b shows the energy usage by load for both the original data and the synthetic data. This is useful for determining which device is consuming energy in real-time. Additionally, it identifies high-consumption devices for efficiency improvements. It generates more load samples to train a machine learning model. Additionally, it reduces the overuse of electrical devices in the industry and helps schedule loads efficiently.
Energy vs CO2 by load
The energy usage metrics processed by TinyML with CTGAN present an evaluation pipeline where the input load data is pre-processed, with the load data split based on the equipment’s run, at a ratio of 70% for training and 30% for testing. After initial processing is completed, CTGAN augmentation is processed to balance the data classes. The proposed model is trained using hyperparameters and an optimizer for efficient estimation, with k-fold cross-validation performed over 30 runs. Then, the TinyML deployment is tested with quantized, pruned, and flashed into memory as an ESP32. After flashing the model into memory, the inference latency and RAM usage are analyzed on resource-constrained devices using the memory operator. Finally, energy load usage week weekdays are analyzed with low and high loads, where medium load dates need to be checked normal process is expressed in the figure below.
The TinyML is used to optimize the running of resource constrained devices and the CTGAN is used to generate the synthetic data which can be augment imbalanced datasets. The Fig. 10 depicts clearly the reduced energy wastages and emissions. Also, it has identified the high impact loads with inconsistent loads.
Average energy consumption
The combination of TinyML and CTGAN in the industry 5.0 gives energy efficiency and emission reduction. By using the average energy consumptions, the load types can be identified easily. The Fig. 11 illustrates the average energy consumption.
The energy consumption are the mandatory parameters for improving the industry environments. It gives clear feedback to operators on emissions and consumption. It supports real-time tracking of environmental impact. It works offline and continues to monitor without external servers. It improves the model accuracy with synthetic data and runs it on edge devices.
Lagging power factor
The lagging power factor is defined as the condition in which the current waveform lags behind the voltage waveform in electrical systems. Inductive loads, such as motors, transformers, and HVAC systems, are responsible for this. Figure 12 illustrates the lagging power factor which are obtained during the implementation of the proposed work.
The lagging power factor is very important in the field of smart load classification. From Fig. 12, it is clearly classified as light, medium, and maximum load in both the original and synthetic data. The electrical devices will create a magnetic field as a part of their operations, which leads to lag voltage. This may incur penalties due to the low power factor. This may require power factor correction using the capacitors.
Hourly load type
The hourly load type prediction in the smart load classification is required for the time dimension of the proposed classification model. This is a perfect parameter because the load pattern may vary significantly by hour in industrial settings. Figure 13 illustrates the hourly load type of the proposed model.
Figure 13 illustrates the hourly load types of the original data and the synthetic data. It will categorise the type of electrical load by hour of the day, such as motor running hours, standby loads, and others. This may improve the temporal intelligence of the proposed model. Additionally, it detects when inefficient loads are active using time-aware insights. Using human-centric operations will help the operator understand machine behaviour hourly.
Hourly energy usage
This parameter adds time-based energy consumption analysis to the proposed model. This will be more supportive of load profiling, demand forecasting and operational optimisation. This enhances the decision-making process by taking into account energy usage.
Figure 14 defines the high usage of load and CO2 wastage periods. Here, the period of 10:00 to 13:00 h is identified to track peak consumption hours, where the daily load consumption reaches 28% and CO2 Emissions reach 30% of wastage. After tracking mean consumption, high wastage periods occur during non-production, appearing at 14:30 h, which contribute 6.7% wasted during standby. These wastages are correctly predicted by the proposed model, suggesting the mitigation, which includes the shutdown of unused machines during peak time, which minimizes the load and CO2 emissions.
Proposed model performance analysis
The performance analysis involves both evaluating the machine learning model and assessing the system-level impact. The machine learning model analysis can be evaluated by calculating accuracy, precision, recall, and F1-scores. System-level analysis can be conducted with the help of light loads, medium loads, and maximum loads in an industrial environment.
Figure 15 depicts the results as (a) shows the per-class precision and recall with mean across 30 runs, (b) shows the overall accuracy of the baseline model with the proposed TinyML with CTGAN, and finally (c) defines the model size vs. latency trade-off for 200 estimator trees with error bars. It achieves a load type prediction accuracy of 95%, which is significantly high in smart industry environments. Like accuracy at 95%, the other features, such as NSM at 0.3, hour at 0.2, power usage at 1.4, lagging current at 0.07, and month values at 0.06, RBF kernel mean heuristic 0.038 are also predicted correctly for final validation.
Synthetic data validation
The proposed model utilizes the tabular condition (CTGAN) to compute the fidelity function, where the per-feature KL divergence for real and synthetic data is accessed with Frobenius normalization. The results are expressed in Fig. 16, where NSM is 0.021, Current usage is 0.037, CO2 emission is 0.042, lagging current is 0.033, and normalization is 0.11, computed to preserve inter-feature correlation and achieve class balancing.
Statistical testing K fold cross validation
The proposed model was evaluated using 10-fold cross-validation for 30 independent runs. During each fold of the proposed TinyML with CTGAN process, a Paired two-sided t-test is performed to compare the mean accuracy level at 95% confidence with that of other models. Similarly, models like XGBoost and LightGBM are also analyzing the predictive load in an Industry 5.0 standard. The proposed model achieves an accuracy of 95% with a mean of 0.8, and p-values of 0.05 are obtained using the Wilcoxon signed-rank test. The other state-of-the-art model, like XGBoost, achieves an accuracy of 94.3% with a mean of 1.1 and a p-value of 0.09. Similarly, LightGBM achieves an accuracy of 94.8 with a mean of 1.2 and a p-value of 0.21. Compared to all other models, the k-fold cross-validation is stable in achieving accuracy with a 95% confidence level for the proposed TinyML with CTGAN, which exhibits significant performance in the tabular setting for analyzing load in the smart industry, as expressed in Fig. 17.
Ablation study of CTGAN
The results are analyzed with three different training of CTGAN considered as ablation, where initial process is processed with original data where accuracy as 93.8% with minority recall as 85.1%, next with original + CTGAN mixed achieve an accuracy as 95% with minority recall as 91.3%, finally with 100% synthetic test set archives 92% accuracy with minority recall as 88.4%. The mixed data improve minority recall by 6% and increase accuracy by 25% compared to the original training set, demonstrating that the proposed model, incorporating TinyML and CTGAN, is beneficial for predicting load and CO2 emission classification in class-imbalanced tabular data, as shown in Fig. 18.
The quantitative distribution defines the TinyML model fused with CTGAN fidelity evaluated augmentation methods like SMOTE, ADASYN, CVAE a real test set, where regular training with entirely original data accuracy as 93.8%, some original and synthetic add-ons achieved accuracy as 95%, fully synthetic seed data as 92.6%, and finally, minimum class recall increases from 85 to 91% for combining both synthetic and original data expressed in Fig. 19.CTGAN produce the best trade off with lowest MMD as 0.003 and correlation distance as 0.11 and highest mixed mean accuracy as 95% due to this comparative experiment the tabular industrial data which contain different categorical feature and multi model distribution desired to produce good comparative result than other augmentation comparative experiment models.
The Fig. 20 represents the load type prediction. The proposed work is correctly predicted the light load, medium load and maximum load. The time taken by the TinyML on the devices are very less, so the power used by the devices can be inferred easily. The Table 4 illustrates the comparison of the proposed model with existing methods.
The TinyML used in the research is ahead of other ML model baselines, such as quantized MLP and Bonsai, where the size of the MLB is 96KB and Bonsai is 72KB. Still, the accuracy attained by the models is 92.1% and 89.4%, which are relatively low compared to Random Forest, which achieves superior accuracy, a smaller model size, and a lower latency trade-off. The proposed model is very competitive and it gives accuracy of 95% which is significantly high when compared to other models. It is a lightweight model when compared to LSTM, CNN + LSTM and TabNet. The CTGAN is a futuristic approach as it balances the dataset for load prediction. When compared to XGBoost and lightBGM models, the proposed model is good in speed. When compared to the deep learning models, the proposed work achieves better accuracy without the support of massive computational power.
Practical deployment analysis
The practical deployment of this proposed model involves the concept drift detection, which is achieved using a 1-minute window monitor to classify the load probability. This detector helps analyze selective load data with a centralized training set. The window monitor runs continuously on the device, requiring minimal computational resources. After monitoring the load probability feature, the cost is analyzed using a rolling window function with a 5-minute timestep to calculate the load and CO2 emissions. This analysis incorporates exponential moving averages, with a 3.4ms inference latency, which includes sensor readings of load and emission features. Finally, the system latency is analyzed with an end-to-end sensor read and action display, where the mean latency lies around 3.4ms, based on input-output overhead. This real-time latency is more suitable for real-time implementations in industry operations, such as alerts and load classifications.
Conclusion and future works
This research presents a significant approach to smart load classification by combining TinyML with CTGAN in industrial 5.0 environments. From the above analysis, it can be seen that the primary objective of this research is to meet the industry 5.0 standard for load prediction by achieving sustainability, utilising energy feature interpretation, and developing a load analysis dashboard to enable effective work schedules and daily operations, thereby confirming a human-centric approach. The second process is attaining sustainability by enabling CTGAN, which captures high CO2 emission working hours, suggesting a shift in working hours to minimise CO2 emissions by 7% from the targeted energy load. Finally, on-device resilience on energy-constrained devices leads to lower operational energy and reduced dependence on server-based networks, all of which are measured as the outcome of properly attaining an Industry 5.0 standard in real-time deployment using generative artificial intelligence with high efficiency in predicted results, applied through an Industry 5.0 regulation framework. TinyML is utilised for real-time, edge-based interpretations, while CTGAN is employed for generating synthetic data. The proposed model has successfully classified various load types, including light load, medium load, and maximum load, based on features such as NSM, power usage, lagging power, leading power, and others. It enables the monitoring and intelligent energy management of electrical systems in Industry 5.0. Using CTGAN, the dataset has been effectively balanced and expanded. By improving the model performance with restricted imbalanced data, many real-time applications can be achieved. TinyML models are trained on this dataset with high accuracy for the deployment of low-power microcontrollers. In general, the model aligns completely with the goals of Industry 5.0 by enhancing sustainability, resilience, and human-centric automation. To extend the future directions of this proposed work, primarily, multivariate time series-based classification can be done. This can be incorporated using LSTM or CNN models instead of TinyML. By doing this, the model can suggest the hourly or daily patterns of the load, and seasonal trends can be identified. By adding an anomaly detection module along with TinyML and CTGAN, it will detect abnormal behaviour in the loads and activate predictive maintenance. Using the dynamic load scheduling with the proposed model, the peak demand for energy is reduced.
Additionally, if the real-time CO2 dashboard is enabled, then monitoring of per-load and per-hour CO2 emissions becomes possible. Incorporating federated learning along with the proposed work gives improved generalizability without sharing the original data. Additionally, enabling the synchronization of edge devices with cloud servers can be utilized for centralized analytics, reporting, and remote monitoring.
Data availability
The datasets used and analyzed during the current study available from the https://www.kaggle.com/datasets/joebeachcapital/steel-industry-energy-consumption and code available at https://github.com/maragatharajanm/smartloadprediction.
References
-
Guo, Y. et al. A novel CALA-STL algorithm for optimizing prediction of building energy heat load. Energy and Buildings. 328, 115207 (2025).
-
Narkhede, G. B., Pasi, B. N., Rajhans, N. & Kulkarni, A. Industry 5.0 and sustainable manufacturing: a systematic literature review. Benchmarking: Int. J.32 (2), 608–635 (2025).
-
Xiang, W. et al. Advanced manufacturing in industry 5.0: A survey of key enabling technologies and future trends. IEEE Trans. Industr. Inf.20 (2), 1055–1068 (2023).
-
Bhat, F. A. & Parvez, S. Emerging challenges in the sustainable manufacturing system: from industry 4.0 to industry 5.0. J. Institution Eng. (India): Ser. C. 105 (5), 1385–1399 (2024).
-
Sharma, M., Sehrawat, R., Luthra, S., Daim, T. & Bakry, D. Moving towards industry 5.0 in the pharmaceutical manufacturing sector: challenges and solutions for Germany. IEEE Trans. Eng. Manage.71, 13757–13774. https://doi.org/10.1109/TEM.2022.3143466 (2022).
-
Raja Santhi, A. & Muthuswamy, P. Industry 5.0 or industry 4.0 S? Introduction to industry 4.0 and a peek into the prospective industry 5.0 technologies. Int. J. Interact. Des. Manuf. (IJIDeM). 17 (2), 947–979 (2023).
-
Taj, I. & Zaman, N. Towards industrial revolution 5.0 and explainable artificial intelligence: challenges and opportunities. Int. J. Comput. Digit. Syst.12 (1), 295–320 (2022).
-
Sindhwani, R. et al. Can industry 5.0 revolutionize the wave of resilience and social value creation? A multi-criteria framework to analyze enablers. Technology in Society. 68, 101887 (2022).
-
Kaswan, M. S., Chaudhary, R., Garza-Reyes, J. A. & Singh, A. A review of industry 5.0: from key facets to a conceptual implementation framework. Int. J. Qual. Reliab. Manage.42 (4), 1196–1223 (2025).
-
Ghobakhloo, M. et al. Behind the definition of industry 5.0: a systematic review of technologies, principles, components, and values. J. Industrial Prod. Eng.40 (6), 432–447 (2023).
-
Sharma, R. & Gupta, H. Harmonizing sustainability in industry 5.0 era: Transformative strategies for cleaner production and sustainable competitive advantage. Journal of Cleaner Production. 445, 141118 (2024).
-
Holsamudrkar, N., Sikdar, S., Kalgutkar, A. P., Banerjee, S. & Mishra, R. A hybrid hierarchical health monitoring solution for autonomous detection, localization and quantification of damage in composite wind turbine blades for TinyML applications. Sci. Rep.15 (1), 12380 (2025).
-
Ganguli, D. et al. S., June. Predictability and surprise in large generative models. In Proceedings of the 2022 ACM Conference on Fairness, Accountability, and Transparency. 1747–1764 (2022).
-
Katib, I., Albassam, E., Sharaf, S. A. & Ragab, M. Safeguarding IoT consumer devices: deep learning with TinyML driven real-time anomaly detection for predictive maintenance. Ain Shams Eng. J.16 (2), 103281 (2025).
-
Njor, E., Hasanpour, M. A., Madsen, J. & Fafoutis, X. A holistic review of the Tinyml stack for predictive maintenance. IEEE Access12, 184861–184882. https://doi.org/10.1109/ACCESS.2024.3512860 (2024).
-
Pai, A., Mishra, K. K., Jeyan, J. M. L. & Sayal, A. Enhanced household energy consumption forecasting using multivariate long short-term memory (LSTM) networks with weather data integration. Results Eng.27, 106512 (2025).
-
Leng, J. et al. Unlocking the power of industrial artificial intelligence towards industry 5.0: Insights, pathways, and challenges. J. Manuf. Syst.73, 349–363 (2024).
-
Zhang, E., Zhou, F., Xi, H., Duan, X. & Liu, J. Predicting Cycle-to-Cycle variations in liquid methane engines using CTGAN-Augmented machine learning. J. Mar. Sci. Eng.13 (8), 1513 (2025).
-
Lu, H., Dai, Y. & Yin, T. Research on small sample carbon emission prediction based on improved timegan: A case study of the Yangtez river delta urban agglomeration in China. J. Environ. Manage.380, 125076 (2025).
-
Hu, J., Duan, P., Cao, X., Xue, Q., Zhao, B., Zhao, X., … Zhang, C. (2025). A multi-energy load forecasting method based on the Mixture-of-Experts model and dynamic multilevel attention mechanism. Energy, 324, 135947.
-
Chakir, O. et al. An empirical assessment of ensemble methods and traditional machine learning techniques for web-based attack detection in industry 5.0. J. King Saud University-Computer Inform. Sci.35 (3), 103–119 (2023).
-
Pourmoradi, N., Ameli, M. T. & Azad, S. A multitask active transfer Learning-Based load shedding using a hybrid graph convolutional Network–Transformer model for transient stability control in power systems with missing data and unseen faults. Results Eng.27, 106952 (2025).
-
Niyayesh, M. & Uygun, Y. Predicting endpoint parameters of electric Arc furnace–based steelmaking using artificial neural network. Int. J. Adv. Manuf. Technol.138 (1), 155–167 (2025).
-
Peruzzini, M., Prati, E. & Pellicciari, M. A framework to design smart manufacturing systems for industry 5.0 based on the human-automation symbiosis. Int. J. Comput. Integr. Manuf.37 (10–11), 1426–1443 (2024).
-
Shkarupylo, V. et al. Exploring the potential network vulnerabilities in the smart manufacturing process of industry 5.052276. https://doi.org/10.1109/ACCESS.2024.3474861 (2024)
-
Ahmed, T., Karmaker, C. L., Nasir, S. B., Moktadir, M. A. & Paul, S. K. Modeling the artificial intelligence-based imperatives of industry 5.0 towards resilient supply chains: A post-COVID-19 pandemic perspective. Computers & Industrial Engineering. 177, 109055 (2023).
-
Dataset Available at https://zenodo.org/records/13378476.
-
Code available online at https://github.com/maragatharajanm/smartloadprediction
-
Bashir, A. K. et al. Comparative analysis of machine learning algorithms for prediction of smart grid stability. Int. Trans. Electr. Energy Syst.31 (9), e12706 (2021).
-
Shapi, M. K. M., Ramli, N. A. & Awalin, L. J. Energy consumption prediction by using machine learning for smart building: Case study in Malaysia. Developments in the Built Environment. 5, 100037 (2021).
-
Aguilar Madrid, E. & Antonio, N. Short-term electricity load forecasting with machine learning. Information. 12(2), 50 (2021).
-
Nallakaruppan, M. K., Dhanaraj, R. K., Shukla, S., Krishnamoorthi, S., Kaushal, R.K., Goyal, M. K., … Quasim, M. T. (2025). A Federated Autoencoder Framework With Explainable AI for Intelligent 6G-IoT Infrastructure Optimization. IEEE Internet of Things Journal.
-
Tan, D., Suvarna, M., Tan, Y. S., Li, J. & Wang, X. A three-step machine learning framework for energy profiling, activity state prediction and production estimation in smart process manufacturing. Applied Energy. 291, 116808 (2021).
-
Priyadarshini, I., Sahu, S., Kumar, R. & Taniar, D. A machine-learning ensemble model for predicting energy consumption in smart homes. Internet of Things. 20, 100636 (2022).
-
Alzoubi, A. Machine learning for intelligent energy consumption in smart homes. Int. J. Comput. Inform. Manuf. (IJCIM)2(1) (2022).
-
Leiprecht, S., Behrens, F., Faber, T. & Finkenrath, M. A comprehensive thermal load forecasting analysis based on machine learning algorithms. Energy Rep.7, 319–326 (2021).
-
Wang, X., Wang, H., Bhandari, B. & Cheng, L. AI-empowered methods for smart energy consumption: A review of load forecasting, anomaly detection and demand response. Int. J. Precision Eng. Manufacturing-Green Technol.11 (3), 963–993 (2024).
-
Pinto, G., Wang, Z., Roy, A., Hong, T. & Capozzoli, A. Transfer learning for smart buildings: A critical review of algorithms, applications, and future perspectives. Advances in Applied Energy. 5, 100084. (2022).
-
Ghazal, T. M. Energy demand forecasting using fused machine learning approaches. Intell. Autom. Soft Comput.31 (1), 539–553 (2022).
-
Tarmanini, C., Sarma, N., Gezegin, C. & Ozgonenel, O. Short term load forecasting based on ARIMA and ANN approaches. Energy Rep.9, 550–557 (2023).
-
Haque, A. & Rahman, S. Short-term electrical load forecasting through heuristic configuration of regularized deep neural network. Applied Soft Computing. 122, 108877 (2022).
-
Song, J. et al. Predicting hourly heating load in a district heating system based on a hybrid CNN-LSTM model. Energy and Buildings. 243, 110998 (2021).
-
Zhou, Y. Advances of machine learning in multi-energy district communities–mechanisms, applications and perspectives. Energy AI. 10, 100187 (2022).
-
Baduge, S. K. et al. Artificial intelligence and smart vision for building and construction 4.0: Machine and deep learning methods and applications. Automation in Construction. 141, 104440 (2022).
-
Nallakaruppan, M. K. et al. Reliable generative interpretable framework for efficient predictive analysis of air quality index. Egypt. Inf. J.31, 100773 (2025).
-
Dong, X., Deng, S. & Wang, D. A short-term power load forecasting method based on k-means and SVM. J. Ambient Intell. Humaniz. Comput.13 (11), 5253–5267 (2022).
-
Kazi, M. K., Eljack, F. & Mahdi, E. Data-driven modeling to predict the load vs. displacement curves of targeted composite materials for industry 4.0 and smart manufacturing. Composite Structures. 258, 113207 (2021).
-
Zhao, X., Gao, W., Qian, F. & Ge, J. Electricity cost comparison of dynamic pricing model based on load forecasting in home energy management system. Energy. 229, 120538 (2021).
-
Laayati, O., Bouzi, M. & Chebak, A. Smart energy management system: design of a monitoring and peak load forecasting system for an experimental open-pit mine. Applied System Innovation. 5(1), 18 (2022).
-
Bellahsen, A. & Dagdougui, H. Aggregated short-term load forecasting for heterogeneous buildings using machine learning with peak Estimation. Energy Build.237, 110742 (2021).
-
Himeur, Y. et al. Next-generation energy systems for sustainable smart cities: Roles of transfer learning. Sustainable Cities and Society. 85, 104059 (2022).
-
Ghosh, S. & Chatterjee, D. Artificial bee colony optimization based non-intrusive appliances load monitoring technique in a smart home. IEEE Trans. Consum. Electron.67 (1), 77–86 (2021).
Funding
Open access funding provided by Symbiosis International (Deemed University). No funding is provided for the preparation of manuscript.
Authors and Affiliations
Contributions
Aanjankumar Sureshkumar: Conceptualization, Methodology, Software, Data Curation, Formal Analysis. Maragatharajan Muthusamy: Literature Review, Validation, Visualization, Writing – Original Draft Preparation. Poonkuntran Shanmugam, Parag Ravikant Kaveri: Supervision, Project Administration, Writing – Review & Editing, Funding Acquisition. Mohamed Yasin Noor Mohamed: Investigation, Resources, Experimental Setup, Data Processing. Sunaina Sridhar: Software Development, Model Implementation, Testing, Performance Evaluation.
Ethics declarations
Competing interests
The authors declare no competing interests.
Conflict of interest
The authors declare that they have no conflict of interest regarding the publication of this paper.
Ethical approval
This article does not contain any studies with human participants or animals performed by any of the authors.
Additional information
Publisher’s note
Springer Nature remains neutral with regard to jurisdictional claims in published maps and institutional affiliations.
Rights and permissions
Open Access This article is licensed under a Creative Commons Attribution-NonCommercial-NoDerivatives 4.0 International License, which permits any non-commercial use, sharing, distribution and reproduction in any medium or format, as long as you give appropriate credit to the original author(s) and the source, provide a link to the Creative Commons licence, and indicate if you modified the licensed material. You do not have permission under this licence to share adapted material derived from this article or parts of it. The images or other third party material in this article are included in the article’s Creative Commons licence, unless indicated otherwise in a credit line to the material. If material is not included in the article’s Creative Commons licence and your intended use is not permitted by statutory regulation or exceeds the permitted use, you will need to obtain permission directly from the copyright holder. To view a copy of this licence, visit http://creativecommons.org/licenses/by-nc-nd/4.0/.
About this article
Cite this article
Muthusamy, M., Sureshkumar, A., Shanmugam, P. et al. TinyML with CTGAN based smart industry power load usage prediction with original and synthetic data visualization towards industry 5.0.
Sci Rep15, 41712 (2025). https://doi.org/10.1038/s41598-025-25678-x
-
Version of record:24 November 2025
-
DOI
:https://doi.org/10.1038/s41598-025-25678-x
