

Abstract
This study investigates the evolving readability of financial reporting by analyzing Item 7 of the 10-K reports over a 26-year period, utilizing a dataset of nearly 200,000 reports retrieved from SEC EDGAR filings. Our analysis reveals a significant decline in the readability of these reports over time, measured using the Fog Index. Specifically, we find that the number of years of schooling required to comprehend these texts increases by nearly one month each year, indicating a growing inaccessibility of financial reports for a substantial portion of the population. To contextualize these findings, we extend our analysis to include data from diverse financial corpora, encompassing almost 10 million documents. While most financial texts have shown a systematic increase in readability over the past decades, the Wall Street Journal emerges as a notable exception, exhibiting a moderate decline in readability-though at a much slower rate compared to Item 7. This study highlights the widening gap in financial text accessibility and underscores the need for more readable financial reporting.
Subjects
- Business and management
- Finance
Introduction
Financial reporting plays a pivotal role in enabling effective communication between corporations and investors. It serves as a critical resource for understanding a company’s financial condition, reducing information asymmetry between managers and shareholders (Leuz and Wysocki, 2016). By providing timely and accurate information about a company’s performance, financial reporting allows investors to make well-informed decisions, thereby fostering transparency, promoting investor confidence, and supporting efficient capital allocation.
Recognizing the importance of clear financial reporting, regulators have increasingly emphasized the need for readability in financial reports and have issued guidelines to improve their clarity. For instance, the SEC’s Plain English Handbook (1998) provides specific instructions on writing clearer disclosures. However, enforcing readability regulations remains challenging due to the absence of precise, quantifiable criteria.
This study analyzes nearly 200,000 Item 7 sections from 10-K reports filed by public firms in the USA over the period from 1996 to 2022, retrieved from the SEC’s EDGAR database.Footnote1 Item 7, formally titled “Management’s Discussion and Analysis of Financial Condition and Results of Operations” (MD&A), was chosen due to its less formal and constrained nature compared to other 10-K sections. It provides investors with the management’s perspective on the company’s financial conditions, operating results, and other factors affecting the firm’s performance.
Our results demonstrate that these reports have become significantly less readable over time. The Fog Index for Item 7 increases from 17.6 in 1996 to 20.19 in 2022, at an average rate of 0.09 per year.Footnote2 Given that the Fog Index corresponds to the years of education required to comprehend a text, this growth suggests that over one additional month of education is needed each year to understand these reports comprehensively. This trend implies that financial reports are becoming progressively less accessible to a broader segment of the population.
The observed decline in the readability of financial reports carries significant implications for how investors process information and make decisions. Declining textual accessibility is likely to increase the cognitive load on readers, potentially impairing comprehension and leading to suboptimal investment choices. While this paper focuses on empirically documenting readability trends, these trends are theoretically grounded in established research on cognitive processing. Working memory has a limited capacity for handling information simultaneously (Miller, 1956; Cowan, 2001), and longer, multiclausal sentences are known to impose greater cognitive load. Such sentence structures require more processing resources, which may deplete working memory and hinder comprehension (Saussereau et al., 2014; Gilchrist et al., 2008; Martín-Aragonese et al., 2023). For elaboration, see Supplementary Appendix B.
To contextualize these findings, we complement our analysis of Item 7 with data from various corpora of financial texts from different platforms, encompassing nearly 10 million documents. This supplementary analysis provides valuable insights into the overall trends in the readability of financial texts over the same period. Interestingly, while most financial texts do not show a significant increase in complexity, the Wall Street Journal stands out as an exception, displaying a moderate decline in readability.
This study makes three key contributions to the literature on financial reporting readability. First, we focus specifically on Item 7, the “Management’s Discussion and Analysis” section of 10-K reports, rather than the entire 10-K report.Footnote3 This approach allows us to isolate and examine language complexity trends within this specific section, which is directly intended to inform stockholders and potential investors. By focusing on Item 7, we avoid the potential confounding effects of various regulatory requirements that have been added to other sections of the 10-K report over time.Footnote4
Second, we establish a robust connection between the evolving readability of financial reports and the educational requirements of their readers. By examining how readability has changed in relation to education levels, we shed light on the changing dynamics of investor access and comprehension of these reports.
Finally, our study covers a period of more than 26 years, allowing us to analyze readability trends over a significant timeframe. We establish relevant benchmarks for these trends by comparing Item 7 to reputable academic journals such as the Journal of Accounting and Economics (JAE), the Journal of Banking and Finance (JBF), and the Quarterly Review of Economics and Finance (QREF), as well as to financial and non-financial texts, including the Wall Street Journal. This comprehensive approach enables us to consider the impact of broader changes in the financial landscape on the complexity of financial reporting.
Our analysis reveals that Item 7 has the lowest readability score (i.e., it is the most difficult to read, exhibiting the highest Fog Index) among all the corpora we examined. Moreover, this readability gap has widened over time. By expanding the scope and variety of texts examined compared to previous research, our study not only provides a detailed description of readability changes but also enables exploration of the forces driving these transformations. Our findings suggest that even within the complex domain of finance, financial reports have become increasingly less readable compared to other financial texts.
The paper is organized as follows: Section “Literature Review” reviews the relevant literature; Section “Methodology” outlines our methodology; Section “Data” describes the data used; Section “Results” details our results; and Section “Conclusions and Discussions” discusses these findings and concludes the paper.
Literature review
The finance sector is currently grappling with an unprecedented surge in data volumes, which are essential for informed decision-making (Fang and Zhang, 2016). Despite significant advancements in automated quantitative and text-analysis tools (De Prado, 2018) and the rise of FinTech (Philippon, 2016), the majority of financial information remains text-based, constituting approximately 80% of annual financial disclosures (Lo et al., 2017). This growing volume of text has raised concerns about the diminishing value of financial disclosures due to their sheer quantity. As early as 1994, Ray Groves noted, “The sheer quantity of financial disclosures has become so excessive that we’ve diminished the overall value of these disclosures” (Groves, 1994, p. 11). This sentiment was echoed by former SEC chairman Arthur Levitt, who stated, “Because many investors are neither lawyers, accountants, or investment bankers, we need to start writing disclosure documents in a language investors can understand: plain English” (SEC, 1998, p. 3). These statements are even more relevant today, as the average length of a 10-K report has nearly tripled since 1996.
Academic interest in the readability of 10-K reports has grown considerably in recent years. Li (2008) was a pioneer in this area, linking the readability of 10-K reports to company earnings. His work was expanded by Biddle, Hilary, and Verdi (2009), who found that more readable financial reports are associated with reduced investment errors. De Franco et al. (2015) and Hwang and Kim (2017) further established a link between the readability of analysts’ reports and trading volume, noting that less readable disclosures can reduce firm value by an average of 2.5% for each standard deviation decrease in readability.
The impact of readability extends beyond investor behavior. Lehavy et al. (2011) found that less readable reports result in greater analyst dispersion and less accurate recommendations. Lawrence (2013) observed that retail investors tend to favor companies with shorter, clearer financial reports. Nelson and Pritchard (2016) demonstrated that firms facing higher litigation risk tend to produce more readable reports, while Guay et al. (2016) found that firms use voluntary disclosure to mitigate the adverse effects of complex financial reports.
Recent studies have uncovered additional implications of readability. For example, Topal (2023) demonstrated the potential of using online news as a tool for language learning across a variety of educational settings. Boubaker et al. (2019) and Kim et al. (2019) linked less readable filings to reduced stock liquidity and increased stock price crash risk, respectively. Hsieh (2021) identified a negative correlation between readability scores and the conservatism of credit rating agencies. Furthermore, Xu et al. (2018, 2020) and Rjiba et al. (2021) explored the impact of readability on various factors such as management age, trade credit, and the cost of equity. In particular, Baxamusa et al. (2018) noted that poor readability in a partner firm’s 10-K negatively impacts stock returns when a strategic alliance is announced.
Moreover, Hasan (2020) found a positive relationship between managerial ability and readability in profitable firms. Abu Bakar and Ameer (2011) demonstrated that companies with good financial performance tend to report their CSR narratives in simpler language, using short sentences that are easy to comprehend.Footnote5
Focusing on the evolving readability of financial reports over time, we hypothesize that readability has decreased, leading to increased complexity in these documents. This hypothesis is critical to ongoing discussions about the need for financial reports to be more accessible and transparent, emphasizing the importance of making financial information understandable for all stakeholders.
Hypothesis (H1): The readability of financial reports, particularly Item 7 of 10-K filings, has decreased over time, indicating a trend toward greater complexity in these documents.
This hypothesis underscores the significance of enhancing the clarity of financial reports to ensure that they remain accessible and informative for all users, thereby supporting transparency and informed decision-making in financial markets.
The evolving readability of financial reporting, a central investigation of this study, carries significant implications for how market participants process information. Cognitive Load Theory (CLT) provides a pertinent theoretical lens, positing that human cognitive capacity is limited. CLT distinguishes between intrinsic load, the inherent difficulty of the material (influenced by factors such as an individual’s financial literacy (Lusardi and Mitchell, 2014)); extraneous load, which is imposed by suboptimal presentation of information (e.g., poor disclosure design (Sweller, 1994)); and germane load, representing the constructive mental effort dedicated to schema acquisition and automation (Parte et al., 2018). An effective disclosure environment, therefore, should aim to manage intrinsic complexity while minimizing extraneous cognitive burdens to facilitate productive germane processing.
When financial disclosures induce high cognitive load, whether from inherent complexity, diminished readability, or inefficient presentation, the quality of investor information processing and subsequent decision-making tends to degrade (Asay et al., 2017). The considerable volume of information typically found in financial reports can further exacerbate this issue, potentially culminating in information overload—a state where the quantity of data surpasses an individual’s processing capacity, thereby impairing judgment (Eppler and Mengis, 2004).
Empirical research indicates that investors exhibit a attenuated response to information embedded within less readable disclosures (Cui, 2016). Experimental findings corroborate this, showing that investors confronted with such reports express lower comfort in evaluating firms and assign less weight to the information therein (Asay et al., 2017). This may also lead investors to increase their reliance on external information sources, diverting attention from difficult-to-process firm-specific disclosures (Asay et al., 2017). Such effects can be particularly acute for retail investors, who may possess fewer resources to decode complex financial narratives compared to their institutional counterparts (Lawrence, 2013). Kelton (2006) documented that heightened complexity results in individuals acquiring less relevant information and forming less accurate interpretations. Similarly, navigating information-dense financial reports can trigger cognitive overload, leading to curtailed information gathering and less precise investment choices (Hales et al., 2011). A constrained attentional capacity, when faced with an overabundance of information, not only compromises processing ability but also contributes to increased information asymmetry in the market (Bernales et al., 2023; Mugerman et al., 2022), potentially elevating perceived information risk and, consequently, the risk premiums demanded by investors.
The imposition of cognitive constraints often compels investors to adopt simplified decision strategies and rely on heuristics (Cui, 2016). As Kahneman (2011) established, cognitive strain typically promotes a shift from effortful “System 2” analytical processing to more intuitive “System 1” thinking. This can manifest through several documented biases:
-
Sentiment reliance: With less readable disclosures, investors may place greater emphasis on the general tone of the document rather than on detailed financial data (Asay et al., 2017).
-
Anchoring on salient information: Individuals may gravitate towards easily processed headline figures, potentially neglecting crucial contextual details (Kelton, 2006), a behavior consistent with selective attention under cognitive pressure (Payne et al., 1993).
-
Dilution effects: The presence of convoluted presentations can impede investors’ ability to differentiate between pertinent and extraneous information (Kelton, 2006).
-
Increased risk-taking: Under cognitive load, investors might default to simplified decision rules that inadequately account for downside risks, a tendency potentially amplified by affective responses (Lahav et al., 2025; Shiv and Fedorikhin, 1999).
The aggregation of these individual-level cognitive responses can precipitate observable market-level phenomena. Specifically, firms characterized by less readable disclosures have been found to exhibit delayed price adjustments and more pronounced post-announcement drift (Asay et al., 2017; You and Zhang, 2009). Bernales, Valenzuela, and Zer (2023) documented diminished trading activity during periods of heightened information load. The same study also associated market-wide information overload with increased subsequent returns, suggesting investors demand compensation for the elevated information risk. Furthermore, complex disclosures can exacerbate information asymmetry between sophisticated and retail investors, potentially impacting bid-ask spreads and firms’ cost of capital (Bernales et al., 2023; Bloomfield, 2002).
Illustrating the nuanced effects of disclosure volume, Impink, Paananen, and Renders (2022) reported an inverted-U relationship between the quantity of regulatory disclosures and the quality of analyst decisions. While initial increases in disclosure can be beneficial, excessive disclosure was associated with “an increase in analyst delay and dispersion and a decrease in accuracy,” an effect more pronounced for analysts with less experience or fewer resources.
Collectively, these findings underscore that substantial cognitive load, intensified by the characteristics of financial reports investigated in this paper, influences not only individual investor behavior but also broader market dynamics. Such an impediment to efficient information processing can diminish market efficiency and elevate perceived risk. Consequently, the readability and design of financial disclosures emerge as critical factors for fostering well-informed and efficient capital markets.
Methodology
In this project, we adopt one of the most widely used metric of text readability: the Gunning-Fog Index Footnote6, defined as (1):
$${Gunning}-{Fog}=0.4,cdot, left[left(frac{{words}}{{sentences}}right)+100,cdot ,left(frac{{complex; words}}{{words}}right)right]$$
Gunning-Fog index (Gunning, 1968) combines the text average sentence length with the frequency of complex words, defined as words composed of three or more syllables (except proper nouns, compound words and jargon, and excluding common suffixes). The index is scaled to represent the years of schooling necessary for text comprehension.
The choice of the Gunning-Fog index aligns with the endorsement of former SEC chairman Christopher Cox, who suggests that metrices such as the Gunning-Fog and Flesch-Kincaid can serve as benchmarks for evaluating compliance with plain English rules (Cox, 2007). See Supplementary Fig. C1 – C2 and Supplementary Table C1 for a detailed comparison across multiple readability metrics.
The utilization of the Gunning-Fog Index in financial literature is prevalent, and some researchers have even referred to it as a measure of financial statement readability (Biddle et al., 2009). To accurately identify sentences for analysis, which is a critical prerequisite for the correct computation of the Gunning-Fog Index, we employ the NLTK implementation of the PUNKT algorithm in Python (Kiss and Strunk, 2006). This implementation demonstrates state-of-the-art accuracy across various text types (Read et al., 2012).
An alternative approach to measuring readability was proposed by Bonsall et al. (2017), who formulated a new index named Bog index to calculate the readability of a 10-K. Unfortunately, the Bog index is not reproducible. Some of its components are generated by StyleWriter-The plain English Editor a proprietary software that is not transparent. Loughran and McDonald (2014, 2016) employed the natural logarithm of the gross file size available for download from SEC EDGAR filings. This line of research revealed a high correlation between file size and document readability.Footnote7
While these proxy measures may be relatively straightforward to compute, they are not applicable for assessing the readability of Item 7. Given the specific focus on Item 7 in our analysis, we require a more nuanced and targeted approach to capture the readability dynamics of this particular section. For an in-depth exploration of the methodologies employed in this and previous research, please see Supplementary Table A1 and Supplementary Figs. A1–A3.
In our analysis, we begin by employing a linear approximation to identify the evolving trend in readability over time. This method allows a straightforward comparison of financial reporting readability trends across various corpora.
Furthermore, specifically focusing on Item 7, we implement a year-by-industry fixed effects model, which includes robust standard errors adjusted for heteroscedasticity, clustered at the firm level. Our regression model is structured as follows (2):
$${{Gunning}-{Fog; Index}}_{n,t}=alpha +{lambda }_{t}+{varphi }_{i}+{varepsilon }_{n,t}$$
In equation (2), Gunning—FogIndexn,t represents the Gunning-Fog Index of Item 7 in the 10-K report of company n in year t. The term λt denotes the fixed effects for the year, and ({varphi }_{i}) represents the fixed effects for the industry, utilizing the Fama and French 12-industry classification. The term ({{mathcal{E}}}_{n,t}) is a robust error term, clustered at the company level.
This specification allows us to measure the impact of time on the readability index, controlling for variability across different industries.
In this article, we utilize data from multiple corpora. Initially, we extract all 10-K reports from the EDGAR-CORPUS database (Loukas et al., 2021) covering the period between 1996 and 2020 (incl.). Following their methodology, we expanded the dataset to include reports through 2022.Footnote8 resulting in a dataset of 196,234 annual reports. To focus our analysis on Item 7, we removed all duplicate reports, and consider only Item 7 sections containing more than 50 words as shorter sections are insufficient to produce reliable readability estimations. Additionally, we remove outlier items based on the Fog score, eliminating items with scores differing from the mean by more than 2 standard deviations. These procedures yield a final dataset of 176,606 Item 7 reports spanning the years 1996 to 2022.
For benchmark data, we collect information from five sources and registers: the Wall Street Journal (WSJ), Reddit financial forums,Footnote9 the Credit Card Agreements Database (CCADB),Footnote10 and The Telegraph, along with academic papers in several finance and accounting journals.
Regarding the Wall Street Journal, we download the first paragraphs of articles freely available from 1998 to 2021, resulting in a total of 1,163,603 articles. While limited data availability entails using a relatively short segment of each article visible beyond the newspaper paywall, it is sufficient for capturing the evolving complexity over time.
We retrieve all available Reddit comments published between December 2005 and 2020 in popular financial subreddits, including personalfinance, Frugal, Economics, business, investing, and financialindependence. Initially, we download 25,537,689 comments, but retain 7,599,652 comments for analysis after applying various filtering criteria (e.g., excluding comments from AutoModerator or TotesMessenger, removing moderator-generated comments with specific and non-financial messages).
The Credit Card Agreements Database (CCADB) provides 103,305 credit card agreements from over 600 issuers in the USA, collected quarterly from 2011 to 2022 as required by the CARD Act. Since the agreements are in PDF format, we employ computer vision techniques to extract text and calculate the Fog Score.Footnote11 We remove non-readable agreements which yield poor OCR quality and inverted PDFs that cannot be parsed correctly, resulting in 93,536 credit card agreements for analysis.
To complement our analysis with texts from news domain, we scrape 1,278,106 articles from The Telegraph, a major English-language newspaper, spanning the period between 2000 and 2015. Similarly to other corpora, we eliminate short articles (under 50 words) and non-news articles (e.g., obituaries, sponsored articles, sport game results). After removing outliers, we are left with 220,527 finance-related articles and 991,606 non-financial articles.
Finally, we gather finance-related academic papers, focusing on those available as PDF files from ScienceDirect. Pre-processing steps involved retaining only research articles and extracting only the relevant texts. We have removed acknowledgments, references, declarations, and appendixes. Tables, headers, and lines without substantial textual content were also filtered out. For the Journal of Accounting and Economics (JAE), out of the initial 1016 articles, we analyze 918 after pre-processing. For the Journal of Banking and Finance (JBF), we analyze 4627 out of 5005 collected articles, while for the Quarterly Review of Economics and Finance (QREF), we analyze 1631 out of 1839 papers.
Table 1 provides a summary of the final sample after cleaning and pre-processing. Overall, our dataset encompasses nearly 10 million written text documents from diverse sources. It should be noted that SEC 10-K reports represent the U.S. financial market as well as the majority of our other data sources.
For the data analysis, we used a dual Xeon Intel(R) Xeon(R) Gold 6342 CPU @ 2.80 GHz workstation equipped with 256GB of RAM and RAID array of HDD drives along with SSD RAID 0 to perform data collection, preprocessing and computation steps for this work.
Results
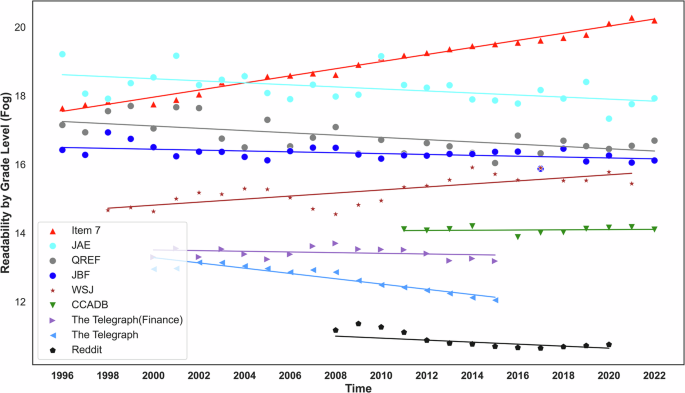
This section presents the core findings of our study, comprehensively visualizing the temporal evolution of the Fog index across various corpora. Figure 1, titled “Readability trends across financial corpora from 1996 to 2022,” illustrates the changes in text readability over time. Of particular significance is the growth observed in the Fog index for Item 7. Starting at a score of 17.6 in 1996, it has steadily increased to 20.19 in 2022, at an average rate of 0.09 per year. This upward trend in complexity underscores the challenges posed by the readability of Item 7 in financial reports. Our results emphasize the importance of addressing the increasing complexity in financial reporting, as it potentially hampers effective communication between corporations and investors.
The distinct trend observed in Item 7 becomes even more pronounced when compared to other corpora in our analysis, particularly financial corpora. Notably, the readability of the CCADB remains consistent throughout the analyzed period (2011–2021), indicating that the articles maintain the same level of readability over the past decade. Similarly, the finance section of The Telegraph newspaper shows a relatively stable Fog score range from 13.3 in 2000 to 13.2 in 2015, with a peak of 13.8 in 2008.
Table 2 provides further insights through the coefficients of the fitted regression line, confirming that Item 7 remains the most challenging corpus to comprehend, exhibiting a positive slope alongside the Wall Street Journal (WSJ). Unlike the decreasing readability of Item 7, the CCADB and The Telegraph finance articles maintain consistent levels of readability over time. However, other corpora show an opposite trend. For example, comments from Reddit reveal a clear trend of improving readability, with the Fog score declining from 11.5 in 2008 to 11 in 2020. Similarly, non-financial articles from The Telegraph show an improving trend, with the Fog score decreasing from 13.2 in 2000 to 12 in 2015. Despite the stability in the readability of The Telegraph’s financial section over the observation period, a notable discrepancy in readability is observed when compared to the rest of the newspaper.
The Wall Street Journal’s divergence from other financial texts, which shows only a moderate decline in readability, can be attributed to several factors. First, the WSJ has a unique editorial approach that prioritizes detailed financial analysis and comprehensive reporting, which often necessitates more complex language. Second, the WSJ targets a highly specialized audience, including financial professionals and institutional investors, who are more likely to appreciate and understand complex financial jargon. Finally, the WSJ’s role as a leading publication in the financial media landscape may drive it to maintain a certain level of sophistication in its reporting, distinguishing it from other media outlets. These factors collectively contribute to the distinct readability trend observed in the WSJ compared to other financial texts.
These findings shed light on the divergent readability patterns across different corpora. While Item 7 demonstrates a concerning decrease in readability, other corpora show trends of improving readability or maintaining consistent levels. This disparity underscores the need to address the readability challenges specific to Item 7, as it plays a crucial role in financial communication.
Across all the tested corpora, we observe varying levels of complexity. Notably, the most challenging corpora, namely research articles from financial and accounting journals, are significantly easier to understand compared to Item 7, and the readability of these academic papers is even improving over time. In contrast, the complexity of Item 7 has grown to such an extent that comprehending a financial report now requires two to four additional years of education, when compared to reading an academic paper.
These findings challenge previous studies in the field, as we uncover clear trends indicating a gradual increase in the text complexity of financial texts over a span of 26 years. Our introduction of a baseline analysis using several general corpora, which does not exhibit a similar trend, further underscores the significance of our results.
Interestingly, although previous studies such as Li (2008), Loughran and McDonald (2009), and Loughran and McDonald (2014) report similar levels of readability, they do not observe these trends. While it is difficult to pinpoint the exact reason for this discrepancy, we speculate that it may be attributed to three key factors.
First, our analysis incorporates a comprehensive text pre-processing phase, including the use of a more accurate sentence-segmentation algorithm (PUNKT algorithm). This change alone could explain the differences in the results, as the definition and identification of sentences play a critical role in analyzing text readability. By employing a more sophisticated approach, we enhance the accuracy and reliability of our findings.
Second, our study benefits from a larger annual dataset, allowing for a more precise estimation of the average readability for each year. Additionally, the extended time span covered by our dataset enhances the sensitivity of trend detection. These factors contribute to a more robust analysis and enable us to capture the evolving complexity trends in financial texts more accurately.
Finally, we focus our analysis specifically on Item 7 rather than the entire report. This intentional concentration offers a plausible rationale for the disparities we’ve identified in contrast to earlier studies. By focusing exclusively on Item 7, we gain the opportunity to delve into specific details that might otherwise remain buried in a broader analysis of the entire report content.
The analysis depicted in Fig. 1 and summarized in Table 1 produces coefficients that quantify the rate of change in readability over time for each corpus. This approach enables a direct comparison across different corpora and provides estimates that can be interpreted in terms of months of education required per year, based on the observed trends. However, it is important to recognize that this analysis assumes a linear progression over time, which may not fully capture non-linear patterns or structural shifts that could occur within the dataset.
In our focused analysis of Item 7, we employed equation (2) to estimate these temporal changes more precisely.Footnote13 Fig. 2: Yearly changes in the Gunning-Fog Index for Item 7 from 1996 to 2022 presents the results of this analysis, displaying the yearly changes in the regression coefficients, with 1996 serving as the baseline reference year.Footnote14 Detailed regression coefficients for each year are reported in Supplementary Table E1. The figure highlights the progression of these coefficients over time, reflecting the evolving complexity of the financial reports. Each point on the graph represents the change in readability from the baseline year, with the capped lines indicating the 95% confidence intervals for these estimates.
The consistent upward trend observed in Fig. 2 suggests a steady increase in the complexity of financial reports over the period examined. The fact that the confidence intervals do not cross zero further reinforces the statistical significance of these findings, indicating that the trend is robust and unlikely to be due to random variation. This consistent increase underscores the growing challenge of making financial disclosures accessible to a broader audience, which could have significant implications for investor comprehension and market transparency.
Moreover, Fig. 2 allows us to visualize not only the overall trend but also the year-to-year fluctuations in readability. These fluctuations may correspond to specific economic events, regulatory changes, or shifts in reporting practices that temporarily alter the readability of financial reports. For instance, notable deviations from the trendline may coincide with periods of economic instability or the introduction of new regulatory requirements that impact how information is presented in these documents.
Additionally, we conducted Wald tests to compare the coefficients of each year against the previous year. Most of these year-to-year differences are statistically significant.
Overall, our results present evidence of the increasing complexity in financial reporting, particularly in Item 7, which serves as a significant departure from previous studies. This allows to provide insights into the changing landscape of text complexity in core financial communication.
Conclusions and discussions
As digital technologies continue to evolve, the volume of information available has surged, particularly with the advent of generative AI technologies. This accelerated proliferation of text, especially in digital formats, is evident across various domains, including financial reporting. While these developments offer unprecedented access to information, they also contribute to the challenge of information overload, which can lead to stress, reduced productivity, and impaired decision-making for those inundated with excessive information.
Our study, covering the period from the mid-1990s to 2022, a time marked by the rise of digitalization, investigates changes in the readability of financial texts. These changes may stem from the increased ease of generating, distributing, and accessing texts in the digital age. Interestingly, while a trend toward simplifying texts is observed across multiple fields, including journalism, literature, and academic writing, financial reporting deviates from this pattern. Instead of becoming more accessible, financial reports have grown lengthier and more complex, diverging from the foundational goals of financial disclosures. Our findings indicate that understanding financial disclosures in the mid-1990s required approximately 17.6 years of education, which increased to 20.1 years by 2022. This trend contrasts sharply with other corpora, where improved readability is evident.
These empirical findings suggest a growing cognitive burden on those who rely on these disclosures. As outlined in the Cognitive Load Theory literature, such increasing complexity can lead to several adverse outcomes. For instance, investors may resort to heuristics, exhibit biases such as sentiment reliance or anchoring, or become more susceptible to information asymmetry (Asay et al., 2017; Bernales et al., 2023). The ‘Lost in the FOG’ phenomenon we observe is not merely a linguistic shift but likely contributes to delayed price adjustments and increased risk premiums as investors grapple with less comprehensible information (Kahneman, 2011; Parte et al., 2018).
The implications of these findings are significant, suggesting that financial reports are becoming increasingly inaccessible to the general public, favoring a specialized group of professionals. The observed decline in the readability of these reports raises concerns about the sustainability of this trend, as it suggests that increasingly higher levels of education will be required to comprehend financial reporting. This challenges the principles of transparency and fairness that are fundamental to financial markets.
Our analysis highlights that existing regulatory frameworks may not be adequately enforcing readability standards in financial disclosures. Despite awareness of these accessibility challenges by regulators and industry leaders such as Warren Buffet, and former SEC Chairmen Arthur Levitt and Christopher Cox, there is a clear need for a more rigorous examination of financial reporting practices.
To address these concerns, we propose the establishment and enforcement of standards for financial report readability. Our dataset and open-sourced algorithms are made available to support this effort. A transparent scale of language complexity, incorporating quantitative parameters, could help ensure that financial information is both accessible and comprehensible to a broader audience. The utilization of large language models, such as BloombergGPT, could play a crucial role in these discussions, thereby enhancing transparency and investor confidence.
Looking forward, our future research will explore the factors driving the increasing complexity in financial reports. We plan to employ more advanced Natural Language Processing (NLP) and Natural Language Understanding (NLU) techniques, such as those based on transformer architectures (Vaswani et al., 2017; Devlin et al., 2019), to analyze text readability with greater accuracy. These methods offer a deeper understanding of context and semantics, surpassing traditional metrics like the Fog Index. Training these models with domain-specific corpora (Liu et al., 2020) will enhance their relevance for analyzing financial reports.
In conclusion, our study uncovers a troubling divergence in financial reporting from broader trends toward increased accessibility and simplicity. There is an urgent need for coordinated efforts to ensure that financial information fulfills its purpose of empowering a diverse range of investors, thereby maintaining an inclusive and equitable market environment.
Data availability
The complete code is publicly available at: https://github.com/Annual-report-financial-readability/Item7-readability.
Notes
-
Electronic Data Gathering, Analysis, and Retrieval (EDGAR) system. https://www.sec.gov/edgar/searchedgar/companysearch.html.
-
One of the most popular measures adopted in the literature is the Gunning-Fog (or simply Fog) Index, designed to represent the complexity of a text in terms of the years of schooling necessary to comprehend it. For example, an index value of 8 indicates a formal eighth-grade education, while 17 corresponds to the reading level of a college graduate. Texts that yield index values of 20 or higher considered as exceedingly difficult and barely readable.
-
We chose to focus on Item 7 in our analysis due to its significance as a means for managerial-level communication and its relevance in previous research studies. Researchers frequently rely on specific items, particularly Item 7, for their investigations. For instance, Goel and Gangolly (2012), Purda and Skillicorn (2015), and Goel and Uzuner (2016) have utilized Item 7 to detect corporate fraud. Feldman et al. (2010) have examined the association between the tone of words in Item 7 and market reactions such as portfolio drift returns. Katsafados et al. (2023) have combined Item 7 (and Item 1) to identify IPO underpricing, while Moriarty et al. (2019) have employed a combination of Item 7 and Item 1 to predict mergers and acquisitions. Additionally, compared to Item 1, Item 7 is relatively “regulatory free” as it focuses less on regulatory rules and requirements. To the best of our knowledge, this paper represents the first research endeavor to specifically analyze the readability of Item 7 only.
-
For instance, a notable trend can be observed in Item 1, where the average number of words has more than tripled from approximately 4600 words in 1996 (out of a total of 14,669 words in the entire 10-K report) to nearly 21,000 words in 2022 (out of a total of 48,000 words in the entire report). In other words, Item 1 alone contributes nearly half of the report’s length in 2022 (see also Lesmy et al. 2019). Conversely, when examining Item 7, we find that its word count has remained relatively consistent, with 7038 words in 2008 compared to 6938 words in 2022. However, it is important to note that text complexity extends beyond the mere length of the report. For further details, please refer to Appendix A.
-
The issue of readability may warrant the implementation of specific regulatory restrictions. An illustrative example is the study conducted by Abudy and Shust (2020), which examines the impact of regulations on vague voluntary disclosures within the oil and gas industry. In their research, they observe that after a series of vague disclosures, the Israeli regulator issued a list of highly specific requirements that were relevant to disclosure practices. Remarkably, Abudy and Shust (2020) find that the implementation of these regulations, aimed at improving readability, resulted in a reduction in investor disagreement surrounding the firms’ announcements. In another research Dyer et al. (2017) used LDA algorithm to show that the regulation sections in the 10 K are the most difficult to understand. This research underscores the potential effectiveness of regulatory interventions in enhancing the clarity and comprehensibility of corporate disclosures, thereby fostering a more informed and consensus-driven investment environment. Another pertinent line of research, as exemplified by Mugerman et al. (2022), highlights the importance of presenting salient information to investors. This research underscores the significance of ensuring that the information provided is attention-grabbing for investors in order to effectively communicate key messages. For further details and an expanded discussion on this topic, please see Appendix B.
-
We replicate the readability analysis that utilizes Gunning-Fog Index with additional popular measures – Flesch Reading Ease and Flesch-Kincaid Grade Level measures, aligning with comprehensive assessment approaches in existing literature (e.g., Xu et al., 2018). All three methodologies produce qualitatively similar results.
-
It is noteworthy that the length of Item 7 has exhibited a relatively consistent pattern over time. Additionally, it is important to recognize that the size of the file does not serve as a reliable indicator for assessing the complexity of the text (more information can be found in Supplementary Appendix A).
-
Their code can be found in the following Github repository https://github.com/lefterisloukas/edgar-crawler.
-
https://www.consumerfinance.gov/credit-cards/agreements/archive/.
-
We convert each pdf to an Image and extract the text using pytesseract python package and Poppler software.
-
To maintain clarity in Fig. 1, we have omitted the confidence intervals. However, for a deeper analysis, see Supplementary Figure D1 includes a graph featuring bootstrap samples with 95% confidence intervals.
-
In our dataset, we found that less than 1% of the reports were missing Standard Industrial Classification (SIC) information, making it impossible to categorize them using the Fama-French industry classifications. Therefore, the sample size utilized for this analysis comprises 174,950 reports.
-
In Supplementary Table E1, we present the coefficients for each year compared to the base year of 1996, along with their statistical significance.
References
-
Abu Bakar AS, Ameer R (2011) Readability of corporate social responsibility communication in Malaysia. Corp Soc Responsib Environ Manag 18(1):50–60
-
Abudy M, Shust E (2020) What happens to trading volume when the regulator bans voluntary disclosure? Eur Account Rev 29(3):555–580
-
Asay HS, Elliott WB, Rennekamp KM (2017) Disclosure readability and the sensitivity of investors’ valuation judgments to outside information. Account Rev 92(4):1–25
-
Baxamusa M, Jalal A, Jha A (2018) It pays to partner with a firm that writes annual reports well. J Bank Financ 92:13–34
-
Bernales A, Valenzuela M, Zer I (2023) Effects of information overload on financial markets: how much is too much? International Finance Discussion Papers 1372. Washington: Board of Governors of the Federal Reserve System
-
Biddle G, Hilary G, Verdi R (2009) How does financial reporting quality relate to investment efficiency? J Account Econ 48:112–131
-
Bloomfield RJ (2002) The “incomplete revelation hypothesis” and financial reporting. Account Horiz 16(3):233–243
-
Bonsall S, Leone A, Miller B, Rennekamp K (2017) A plain English measure of financial reporting readability. J Account Econ 63(2–3):329–357
-
Boubaker S, Gounopoulos D, Rjiba H (2019) Annual report readability and stock liquidity. Financ Mark Inst Inst 28:159–186
-
Cowan N (2001) The magical number 4 in short-term memory: a reconsideration of mental storage capacity. Behav Brain Sci 24:87–185
-
Cox C (2007) Closing remarks to the second annual corporate governance summit. Delivered at the USC Marshall School of Business, Los Angeles, CA, March 23. http://www.sec.gov/news/speech/2007/spch032307cc.htm
-
Cui XC (2016) Calisthenics with words: the effect of readability and investor sophistication on investors’ performance judgment. Int J Financ Stud 4(1):1–14
-
De Prado ML (2018) Advances in Financial Machine Learning. Wiley
-
Devlin J, Chang MW, Lee K, Toutanova K (2019) Bert: pre-training of deep bidirectional transformers for language understanding. Proc NAACL-HLT 2019:4171–4186
-
Dyer T, Lang MH, Stice-Lawrenc L (2017) The evolution of 10-K textual disclosure: evidence from latent dirichlet allocation. J Account Econ 64(2-3):221–245
-
Eppler MJ, Mengis J (2004) The concept of information overload: a review of literature from organization science, accounting, marketing, MIS, and related disciplines. Inf Soc 20(5):325–344
-
Fang B, Zhang P (2016) Big Data in Finance. In Yu S, Guo, S (ed) Big Data Concepts, Theories, and Applications, Springer, pp 391-412
-
De Franco G, Hope OK, Vyas D, Zhou Y (2015) Analyst report readability. Contemp Account Res 32(1):76–104
-
Gilchrist AL, Cowan N, Naveh-Benjamin M (2008) Working memory capacity for spoken sentences decreases with adult aging: recall of fewer, but not smaller chunks in older adults. Memory 16(7):773–787
-
Goel S, Gangolly J (2012) Beyond the numbers: mining the annual reports for hidden cues indicative of financial statement fraud. Intell Syst Acc Financ Manag 19(2):75–89
-
Goel S, Uzuner Ö (2016) Do sentiments matter in fraud detection? Estimating semantic orientation of annual reports. Intell Syst Account, Financ Manag 23:215–239
-
Groves RJ (1994) Financial disclosure: when more is not better. Financ Exec 10:11–14
-
Guay W, Samuels D, Taylor D (2016) Guiding through the Fog: financial statement complexity and voluntary disclosure. J Acc Econ 62(2-3):234–269
-
Gunning R (1968) The Technique of Clear Writing. McGraw-Hill International Book Co., New York
-
Hales J, Kuang XJ, Venkataraman S (2011) Who believes the hype? An experimental examination of how language affects investor judgments. J Acc Res 49(1):223–255
-
Hasan MM (2020) Readability of narrative disclosures in 10-K reports: does managerial ability matter? Eur Acc Rev 29(1):147–168
-
Hsieh YT (2021) Financial statement readability and credit rating conservatism. J Corp Acc Financ 33:145–163
-
Hwang BH, Kim HH (2017) It Pays to Write Well. J Financ Econ 124:373–394
-
Impink J, Paananen M, Renders A (2022) Regulation-induced disclosures: evidence of information overload. ABACUS 58(3):436–478
-
Kahneman D (2011) Thinking, fast and slow. New York: Farrar, Straus and Giroux
-
Katsafados AG, Leledakis GN, Pyrgiotakis EG, Androutsopoulos I, Chalkidis I, Fergadiotis M (2023) Textual Information and IPO underpricing: a machine learning approach. J Financ Data Sci 5(2):100–135
-
Kelton AS (2006) Internet financial reporting: The effects of hyperlinks and irrelevant information on investor judgments. Doctoral dissertation, University of Tennessee
-
Kim C, Wang K, Zhang L (2019) Readability of 10-K reports and stock price crash risk. Contemp Acc Res 36(2):1184–1216
-
Kiss T, Strunk J (2006) Unsupervised multilingual sentence boundary detection. Comput Linguist 32(4):485–525
-
Lahav E, Manos R, Kashy-Rosenbaum G, Sitbon M (2025) Trying to think: an experimental study of the impact of cognitive load on risk-taking by individuals and groups. Financ Res Lett 75:106823
-
Lawrence A (2013) Individual investors and financial disclosure. J Acc Econ 56(1):130–147
-
Lehavy R, Li F, Merkley K (2011) The effect of annual report readability on analyst following and the properties of their earnings forecasts. Acc Rev 86:1087–1115
-
Lesmy D, Muchnik L, Mugerman Y (2019) Doyoureadme? temporal trends in the language complexity of financial reporting. Working Paper. Available at SSRN: https://ssrn.com/abstract=3469073
-
Leuz C, Wysocki P (2016) The economics of disclosure and financial reporting regulation: evidence and suggestions for future research. Acc Res 54:525–622
-
Li F (2008) Annual report readability, current earnings, and earnings persistence. J Acc Econ 45:221–247
-
Liu Z, Huang D, Huang K, Li Z, Zhao J (2020) FinBERT: a pre-trained financial language representation model for financial text mining, Bessiere C (ed.). Proceedings of the Twenty-Ninth International Joint Conference on Artificial Intelligence, IJCAI-20, International Joint Conferences on Artificial Intelligence Organization, 4513–4519
-
Lo K, Ramos F, Rogo R (2017) Earnings management and annual report readability. J Account Econ 63(1):1–25
-
Loughran T, McDonald B (2016) Textual analysis in accounting and finance: a survey. J Account Res 54(4):1187–1230
-
Loughran T, McDonald B (2009) Plain English, Readability and 10-K Filing, https://www3.nd.edu/~tloughra/Plain_English.pdf
-
Loughran T, McDonald B (2014) Measuring readability in financial disclosures. J Finance, LXIX, 1643–1671
-
Loukas L, Fergadiotis M, Androutsopoulos I, Malakasiotis P (2021) EDGAR-CORPUS: Billions of Tokens Make the World Go Round. In Proceedings of the Third Workshop on Economics and Natural Language Processing, pages 13–18, Punta Cana, Dominican Republic. Association for Computational Linguistics
-
Lusardi A, Mitchell OS (2014) The economic importance of financial literacy: theory and evidence. J Econ Lit 52(1):5–44
-
Martín-Aragonese MT, Mejuto G, Del Río D, Fernandes SM, Rodrigues PFS, López-Higes R (2023) Task demands and sentence reading comprehension among healthy older adults: the complementary roles of cognitive reserve and working memory. Brain Sci 13(3):428
-
Miller GA (1956) The Magical Number Seven Plus or Minus Two. Some limits on our capacity for processing information. Psychol Rev 63:81–97
-
Moriarty R, Ly H, Lan E, McIntosh SK (2019) Deal or no deal: predicting mergers and acquisitions at scale. In 2019 IEEE International Conference on Big Data Los Angeles, CA: 5552–5558
-
Mugerman Y, Steinberg N, Wiener Z (2022) The exclamation mark of Cain: risk salience and mutual fund flows. J Banking Financ 134 https://doi.org/10.1016/j.jbankfin.2021.106332
-
Nelson K, Pritchard AC (2016) Carrot or Stick? The shift from voluntary to mandatory disclosure of risk factors. J Empir Leg Stud 13:266–297
-
Parte L, Garvey A, Gonzalo-Angulo JA (2018) Cognitive load theory: why it’s important for international business teaching and financial reporting. J Teach Int Bus 29(2):134–160
-
Payne JW, Bettman JR, Johnson EJ (1993) The adaptive decision maker. Cambridge University Press
-
Philippon T (2016) The FinTech Opportunity. National Bureau of Economic Research working paper 22476. https://www.nber.org/papers/w22476
-
Purda L, Skillicorn D (2015) Accounting variables, deception, and a bag of words: assessing the tools of fraud detection. Contemp Acc Res 32(3):1193–1223
-
Read J, Dridan R, Oepen S, Solberg LJ (2012) “Sentence boundary detection: along solved problem?”, Proceedings of COLING, pp 985–994
-
Rjiba H, Saadi S, Boubaker S, Ding XS (2021) Annual report readability and the cost of equity capital. J Corp Financ 67:101902
-
Saussereau E, Guerbet M, Anger JP, Goulle JP (2014) Memory impairment after drug-facilitated crimes. in Toxicological Aspects of Drug-Facilitated Crimes (ed) P. Kinnz, Academic Press, pp 121–138
-
SEC (1998) A plain english handbook: how to create clear SEC disclosure documents. Office of Investor Education and Assistance, U.S., http://www.sec.gov/pdf/handbook.pdf
-
Shiv B, Fedorikhin A (1999) Heart and mind in conflict: the interplay of affect and cognition in consumer decision making. J Consum Res 26(3):278–292
-
Sweller J (1994) Cognitive load theory, learning difficulty, and instructional design. Learn Instr 4(4):295–312
-
Topal İH (2023) Leveraging online news for language learning across diverse educational contexts. Lit Trek 9(3):1–28
-
Vaswani A, Shazeer N, Parmar NN, Uszkoreit J, Jones L, Gomez AN, Kaiser Ł, Polosukhin I (2017) Attention is All you Need, NeurIPS, https://proceedings.neurips.cc/paper_files/paper/2017/file/3f5ee243547dee91fbd053c1c4a845aa-Paper.pdf
-
Xu H, Trung HP, Dao M (2020) Annual report readability and trade credit. Rev Acc Financ 19(3):363–385
-
You H, Zhang X (2009) Limited attention and stock returns: evidence from a structural-break CUSUM test. J Financ Quant Anal 44(6):1323–1349
Acknowledgements
This research was supported by the Israel Science Foundation (grant nos. 2566/21 and 148/25), the U.S.–Israel Binational Science Foundation (BSF; grant no. 2022201), the Israel Innovation Authority (grant no. 78560), the David Goldman Data-Driven Innovation Research Center, and the Gershon FinTech Center.
Authors and Affiliations
Ethics declarations
Competing interests
The authors declare no competing interests.
Ethical approval
This study does not involve human participants or their data.
Informed consent
As the study does not involve human participants, informed consent was not required.
Additional information
Publisher’s note Springer Nature remains neutral with regard to jurisdictional claims in published maps and institutional affiliations.
Supplementary information
Rights and permissions
Open Access This article is licensed under a Creative Commons Attribution-NonCommercial-NoDerivatives 4.0 International License, which permits any non-commercial use, sharing, distribution and reproduction in any medium or format, as long as you give appropriate credit to the original author(s) and the source, provide a link to the Creative Commons licence, and indicate if you modified the licensed material. You do not have permission under this licence to share adapted material derived from this article or parts of it. The images or other third party material in this article are included in the article’s Creative Commons licence, unless indicated otherwise in a credit line to the material. If material is not included in the article’s Creative Commons licence and your intended use is not permitted by statutory regulation or exceeds the permitted use, you will need to obtain permission directly from the copyright holder. To view a copy of this licence, visit http://creativecommons.org/licenses/by-nc-nd/4.0/.
About this article
Cite this article
Lesmy, D., Muchnik, L. & Mugerman, Y. Lost in the fog: growing complexity in financial reporting—a comparative study.
Humanit Soc Sci Commun12, 1813 (2025). https://doi.org/10.1057/s41599-025-06094-y
-
Version of record:21 November 2025
-
DOI
:https://doi.org/10.1057/s41599-025-06094-y
