

Abstract
This paper presents a data-driven approach for quantifying the resilience of distribution power grids to extreme weather events using two key metrics: (a) the number of outages and (b) restoration time. The method leverages historical outage records maintained by power utilities and weather measurements collected by the National Oceanic and Atmospheric Administration (NOAA) to evaluate resilience across a utility’s service territory. The proposed framework consists of three stages. First, outage events are systematically extracted from the outage records by temporally and spatially aggregating coincident component outages. In the second stage, weather zones across the service territory are delineated using a Voronoi polygon approach, based on the locations of NOAA weather sensors. Finally, data-driven models for outage fragility and restoration time are developed for each weather zone. These models enable the quantification and visualization of resilience metrics under varying intensities of extreme weather events. The proposed method is demonstrated using real-world data from a Midwestern US distribution utility, focused on wind- and precipitation-related events. The dataset spans two decades and includes over 160,000 outage records. The data-driven models accurately capture the nonlinear relationship between weather intensity, outage accumulation, and restoration time, and the resulting zone-specific resilience maps provide utilities with actionable insights for prioritizing hardening and operational planning.
Subjects
- Climate sciences
- Environmental sciences
- Natural hazards
Introduction
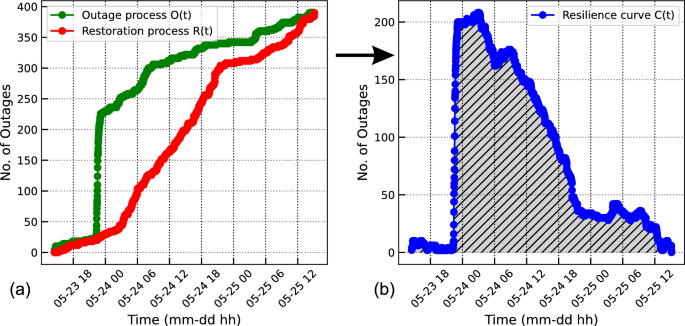
The power distribution systems are responsible for delivering electricity from high-voltage transmission networks to end-use customers through an interconnected network of substations, transformers, overhead and underground lines. Component outages occur randomly within the system and are often caused by factors such as aging infrastructure, animal interference, vegetation contact with power lines, or weather conditions. Among them, severe weather events are a significant contributing factor that can compound the number of outages in a short period of time1, leading to massive economic disruption. The impact of severe weather events on the power system can cause millions of dollars in economic loss2,3. Once extreme weather subsides, the restoration process begins with the dispatch of repair crews to identify, isolate, and repair outages4. The speed and efficiency of this restoration depend on multiple factors, such as weather conditions, the number and size of the outages, the available crews and equipment, access difficulties, and situational awareness of the utility5. However, the restoration rate always lags behind the outage rate. The outage accumulation process and the restoration process during extreme weather events can be studied leveraging the time-stamped records of component outages and restoration through the utility’s outage management system (OMS). A real-case example of outage accumulation and utility response during an extreme event is illustrated in Fig. 1a. Figure 1a illustrates the evolution of outages and restorations during a representative severe wind event. The green curve denotes the cumulative number of component-level outage occurrences (O(t)), which is characteristic of the impacts of extreme events. In contrast, the red curve (R(t)) denotes the cumulative number of completed component-level restorations, which typically lags behind the outage rate. Because outages and restorations proceed concurrently during severe weather, it is common for both curves to rise over the same time window as the storm causes new failures while crews restore earlier ones. Although resilience can also be visualized using customer-restoration trajectories, this study adopts a component-outage-based representation consistent with the statistical outage-restore process framework. Component-level outage events are the fundamental units recorded in utility OMS datasets and provide a tractable and physically grounded basis for modeling both failure accumulation and restoration behavior. By the end of the event, all outages were fully restored. The resilience curve (C(t)) is obtained by subtracting the number of outages from restored ones (i.e., (C(t)=O(t)-R(t))), which is shown in Fig. 1b. The shaded area under the resilience curve is inversely related to grid resilience: the smaller the area, the higher the resilience. However, calculating this area accurately is a challenge. Therefore, we propose two practical resilience metrics: (a) the number of outages and (b) the total restoration time. Minimizing these values corresponds to reducing the shaded area, indicating better resilience.
Resilience metrics have been quantified in the literature using a variety of metrics that capture different aspects of system performance before, during, and after high-impact, low-probability events. A common starting point is to adapt traditional reliability indices such as the System Average Interruption Duration Index (SAIDI), System Average Interruption Frequency Index (SAIFI), and related customer interruption measures to major event conditions. In this approach, resilience is inferred from the magnitude and duration of interruptions aggregated over a reporting period, sometimes distinguishing between “normal” and “severe” days. While these indices are widely available and easy to compute, they are essentially time-averaged statistics and do not explicitly represent the dynamic accumulation and recovery processes during individual extreme events.
To better capture the temporal evolution of system performance, many recent works define resilience metrics from the resilience curve, which tracks the fraction of served load or the number of active outages as a function of time during an event. Typical metrics include the area under (or above) the resilience curve, the minimum performance level (nadir), maximum outage volume, event duration, and average or peak recovery rates6,7,8. For example, event-level metrics derived from utility data have been proposed to quantify restore duration, customer-hours not served, and outage and restore rates as explicit functions of the number of outages in each event9. These resilience-curve-based metrics directly reflect both the severity of disruption and the speed of recovery, and they can be evaluated from historical outage and restoration records without requiring detailed physical simulations. Beyond these event-based quantities, several comprehensive frameworks have been introduced to organize and extend resilience metrics across the outage-recovery phases. Panteli and Mancarella classify operational and infrastructure resilience metrics that quantify loss of load, energy not served, and degraded operating margins under contingency and extreme-weather scenarios10. In distribution systems, composite indices such as the “anticipate-withstand-recover (AWR)” metric have been proposed to support operational and planning decisions, aggregating multiple indicators of preparedness, robustness, and restoration into a single scalar measure11.
However, these existing resilience metrics also have limitations for our specific objective of developing a practical, data-driven, and utility-friendly tool based on operational utility data. First, many metrics are defined at the bulk-power level and rely on detailed simulation models or scenario-based tests, which require significant modeling effort and may not be readily available at the distribution level. Second, system-wide indices covering entire service territories can obscure spatial variability in weather exposure and outage behavior, thereby limiting their usefulness in identifying vulnerable subregions within a utility footprint. Third, composite metrics that combine multiple components (e.g., anticipate, withstand, recover) often depend on subjective weighting and may be difficult for operators to interpret or validate in terms of actionable operational quantities. Finally, while area-based resilience-curve metrics are conceptually appealing, accurately estimating the full resilience curve for every event and every utility territory can be challenging when data are noisy, sparse, or heterogeneous.
In recent years, several works have been made in quantifying the resilience of distribution systems to extreme weather events. These approaches can be broadly grouped into two categories based on their primary focus: Group I – Quantification of Fragility and Resilience Metrics and Group II – Outage Restoration Modeling. Group I – Quantification of Fragility and Resilience Metrics: Fragility models characterize how system components or aggregated areas respond to increasing weather stress. Xu12 developed exponential and power-law fragility models for poles and conductor spans under simulated hurricane conditions, estimating failures as a function of wind speed. Dunn13 and Reed14 constructed empirical and analytical fragility curves from real-world outage data during high-wind events, identifying threshold wind intensities beyond which failure rates rise rapidly. Donaldson15 and Murray16 correlated regional wind gusts with observed fault patterns in the UK, using normalized fragility metrics to compare geographic performance. In particular, Bjarnadottir17 incorporated hurricane intensity and pole design into log-normal fragility modeling for long-term resilience assessment under climate change. In parallel, studies have extended fragility modeling to precipitation-driven events, particularly floods and rainstorms. Liu18 employed spatially generalized linear mixed models to relate hurricane and ice storm outages to precipitation, protection device density, and land features. Al Mamun19 and Davidson20 investigated the combined effects of rainfall, land cover, and storm surge on outage patterns, demonstrating that precipitation intensity significantly correlates with failure rates in flood-prone areas. Carrington7 and Ahmad21 introduced resilience event extraction methods and area-level outage rate curves that quantify the aggregate system response to localized weather measurements, including wind and precipitation. Group II – Outage Restoration Modeling: Restoration modeling under adverse weather conditions has focused on optimizing the timing, sequencing, and deployment of recovery resources. Arif22 formulated a two-stage stochastic optimization problem to co-optimize network operation and crew routing under uncertain repair times, which is particularly relevant during storm-induced flooding, where access and damage assessment are delayed. Tan23,24 proposed mixed-integer linear programs to coordinate hardening and repair actions that minimize unserved energy, incorporating weather-triggered failures and restoration priorities. Jaech25 developed machine learning models to predict restoration durations using features such as cause codes, customer impact, and weather classifications. Cerrai26 and Kezunovic27 utilized decision trees and logistic regression to integrate real-time precipitation and vegetation data to predict the probability of storm outages at fine geographic resolutions. These approaches demonstrate research on rainfall-related disruptions, which often involve cascading effects such as water intrusion, landslides, and saturated terrain conditions that complicate field response. In contrast to these resource-intensive simulations, Ahmad21 presented a data-driven alternative by modifying historical outage records to reflect faster or earlier restoration scenarios, allowing utilities to rapidly estimate resilience improvements from operational improvements.
Despite the valuable progress achieved in existing studies, several important limitations remain that impact their effectiveness and practical relevance. First, many models analyze each outage record as an individual component-level incident, focusing on separate failures and restorations without accounting for the cumulative effect of multiple outages occurring within a short period in the same area. In reality, extreme weather events often result in groups of outages that occur closely in both time and space, placing significant pressure on utility resources. When the number of affected components increases rapidly in a concentrated region, restoration becomes more difficult due to the limited availability of repair crews and equipment. By overlooking the combined nature of these events, existing models may underestimate the full operational impact and provide incomplete assessments of system resilience. Second, most studies do not incorporate detailed spatial analysis of outage data. Service territories are often modeled as uniform areas, with no consideration for localized variations in exposure, terrain, or sensor coverage. Even when spatial zones are used, they are commonly defined as regular grids with fixed dimensions, which do not align with the actual distribution of weather monitoring stations or the geographical features of the infrastructure. This lack of spatial precision limits the ability of the models to reflect localized differences in outage behavior and risk. Third, although some studies attempt to divide systems into resilience zones, their zoning strategies are often based on artificial partitions that do not correspond to the spatial patterns of wind or precipitation. Moreover, most approaches apply a single model framework to both wind-related and precipitation-related outages, despite the fact that these two types of events arise from different causes. Wind events are typically associated with physical damage from falling trees or pressure on poles and wires, while precipitation events are more often linked to water accumulation, soil saturation, and equipment exposure. Using a common model for both types of events may reduce the accuracy of predictions and overlook important event-specific patterns. Finally, a large part of the literature relies on machine learning methods that, although capable of capturing complex relationships, require extensive training data, detailed preprocessing steps, and careful adjustment of model parameters. These requirements can create barriers to adoption in utility environments, where interpretability, computational efficiency, and ease of use are critical. Models that are difficult to understand or maintain may not be suitable for real-time decision-making or for use by operators without specialized technical expertise. These limitations highlight the need for a practical, data-driven framework that can capture the aggregated nature of outages, reflect spatial and weather-related variability, and support straightforward, reliable use in operational settings.
The outage restoration time modeling in existing resilience studies also presents several critical limitations that affect both its transparency and its applicability in operational contexts. First, many existing models estimate restoration performance using simple summary metrics such as average outage duration or mean time to restore. These models typically do not express the restoration time as a function of specific weather intensities or differentiated weather zones. As a result, they cannot predict how restoration dynamics vary under different levels of storm severity or in distinct geographic areas. In particular, restoration time is rarely expressed as a function of specific event intensity levels or spatially defined weather zones. This issue is especially pronounced in machine learning-based approaches, where outage records serve as inputs, and restoration durations are produced as outputs without explicit linkage to event characteristics. Although these models may achieve acceptable accuracy, they function as black boxes, providing little insight into how weather conditions or outage characteristics influence restoration performance. As a result, they offer limited interpretability and are difficult to validate or adapt to new operational conditions. Second, restoration curves in the literature are often constructed without accounting for the influence of outage volume on restoration dynamics. In severe weather events, the number of outages can increase dramatically in a short time, leading to saturation of crews and equipment, significantly slowing the recovery pace. Traditional models tend to assume a static or average restoration rate, failing to reflect the delays caused by high outage density, limited access, or constrained logistic coordination. This lack of sensitivity to outage clustering weakens the ability of models to simulate real restoration behavior during critical events. Third, restoration models commonly adopt the same structure for all weather-related outages, although field conditions and recovery constraints differ between event types. Treating these events with a single restoration formulation overlooks important event-specific patterns and limits the ability of models to support different outage scenarios. These limitations highlight the need for restoration models that are transparent, spatially contextualized, responsive to outage density, and tailored to the unique characteristics of different weather events.
Based on the identified limitations in the current literature, this work aims to provide a fully data-driven, comprehensive, interpretable, and utility-friendly framework for distribution system resilience quantification and outage restoration modeling under extreme weather events. The main objectives, motivations, and contributions of the paper are as follows: First, a framework for delineating the utility’s service territory using the Voronoi polygon method based on National Oceanic and Atmospheric Administration (NOAA) sensor locations is developed to form weather zones. Subsequently, overlaying geospatial mapping of outage records enabled spatially differentiated resilience analysis across these zones. Second, an event extraction method is developed to group temporally and spatially coincident outages, enabling the modeling of cumulative impacts during high-impact weather events. This approach overcomes the limitation of treating outages as isolated incidents, providing a more accurate representation of system resilience. Third, data-driven fragility models are constructed to relate the number of outages in each event to the corresponding weather intensity within defined zones, offering interpretable and zone-specific failure predictions under varying hazard conditions. Finally, restoration time models are formulated by correlating the total restoration duration with the number of outages in each event, capturing the effect of outage volume on restoration performance. Note that separate modeling frameworks are developed for wind and precipitation events, addressing the inaccuracy introduced by applying a single unified model to distinct weather types with fundamentally different operational characteristics.
Methods
This study proposes a data-driven framework for quantifying the resilience of power distribution systems to extreme weather by integrating utility outage data with meteorological observations. The overall workflow, shown in Fig. 2, transforms the raw operational and weather records into zone-specific fragility models, restoration time models, and spatial visualizations of the power distribution system resilience.
The process begins with data acquisition from two main sources: (i) historical outage records from the utility’s outage management system, containing timestamps, locations, cause codes, and customer interrupted, and (ii) NOAA weather data, including hourly sensor measurements and severe weather event records. Both datasets are preprocessed to remove missing or erroneous values. Following data preprocessing, GIS mapping of outage locations is performed to visualize the spatial distribution of historical device failures across the utility service territory. The Voronoi polygon method is applied to divide the service area into wind and precipitation zones, with each zone assigned to its nearest NOAA weather sensor.
The outage data are further organized into outage-restoration events, defined as a continuous period beginning with the first outage that appears and ending when all affected components are restored. This event-based structure captures the cumulative effect of simultaneous outages, which is essential to understand operational stress during major interruptions. The timeline of severe weather events serves as a guide for locating such events within the large-scale outage dataset. Severe weather event logs are then used to extract two subsets of these events: (i) wind events and (ii) precipitation events, based on temporal and location overlap with outage records. With these event datasets prepared, fragility models are developed to quantify the relationship between weather intensity and outage occurrence for each zone. Wind events are linked to wind speed, and precipitation events to precipitation depth, producing exponential functions that represent the expected number of outages at given weather conditions. In parallel, restoration time models are built using all outage-restoration events to relate outage volume to total restoration time, capturing how cumulative outage numbers influence recovery rates.
Finally, fragility and restoration models are integrated for resilience metric visualization. For a given weather condition, such as a specified wind velocity or rainfall depth, the fragility model estimates the number of outages in each zone, which the restoration model then translates into predicted restoration durations. These results are mapped across all zones to provide an intuitive and spatially resolved comparison of resilience, highlighting areas with relatively stronger or weaker recovery performance under specific weather conditions. Note that in this study, the fragility functions represent the expected number of outages occurring within a severe weather event as a function of the weather intensity in that zone. The curves do not represent the probability of failure of individual components; rather, they map aggregated event-level outage counts to observed hazard conditions, consistent with the structure of the available outage data.
Please note that in this paper, maps presented in figures were generated by the authors using GeoPandas (v0.14.0) or QGIS (v3.30). Shapefiles were obtained from the U.S. Census Bureau’s TIGER/Line shapefiles (https://www.census.gov/geographies/mapping-files/time-series/geo/tiger-line-file.html). GeoPandas, QGIS, and all TIGER/Line products are public domain and free for reuse.
Results
Outage and weather data description
This study utilizes two datasets: (i) outage records provided by a Midwestern US distribution utility, and (ii) open weather data and severe weather events from NOAA, including wind and precipitation measurements from multiple weather stations and all severe weather-related extreme event history within the utility’s service area28,29. Both datasets span a 20-year period from 2004 to 2024 and are temporally aligned to support joint analysis.
The outage dataset contains a total of 168,462 individual outage records. Each record corresponds to a discrete outage that affects a component in the distribution system and includes the start and end times of the outage, accurate to seconds; the duration of restoration in minutes; the number of customers interrupted; and the associated cause code. The cause codes in the outage dataset are detailed and associated with each outage. Examples include tree-related causes (e.g., “Tree limb on line,” “Tree outside trim zone”), animal interference (e.g., “Squirrel contact,” “Bird contact”), equipment failures (e.g., “Fuse blown,” “Switch failure,” “Underground cable fault”), and weather-related causes (e.g., “High wind,” “Ice/snow accumulation,” “Lightning strike”). Although the proposed models do not rely directly on cause codes, their specificity helps validate the event categorization and interpret outage patterns.
Before proceeding with analysis, the dataset was carefully preprocessed to improve reliability and internal consistency. Due to equipment malfunctions or manual reporting errors, historical outage data often contains incomplete or inaccurate entries, which can lead to misleading conclusions in data-driven analysis. To address this, records with missing values in key fields, such as timestamps, restoration duration, or customer count, were discarded. In addition, entries with logically inconsistent values were filtered out. These included cases where the restoration time exceeded the overall outage duration or where the values fell outside reasonable operational limits.
The weather sensor data includes hourly wind and precipitation data from 8 stations across the study region. Wind-related features include hourly average wind speed and fastest 2-minute wind speed, all recorded in meters per second. Precipitation-related features include hourly totals of rainfall, snowfall, and ground-level snow depth, measured in inches. All sensor data were preprocessed to ensure temporal alignment with outage records. The severe weather event dataset29 is obtained from a separate NOAA database and consists of documented weather incidents classified by event type. Each record includes a start and end time, accurate to the minute, event type, starting location, and affected area of the event represented as longitude and latitude, and a brief description of the event. The types of events considered in this study include tornadoes, high-speed wind events (classified as wind events), snowstorms, and flooding (classified as precipitation events). However, unlike the weather sensor dataset, severe event records do not contain direct numerical measurements of wind speed or precipitation.
GIS mapping of component outages
To visualize the spatial distribution of the outages in the utility service area, each outage record from the OMS was mapped to its corresponding geographical location. The OMS database provides information on damaged components or protective devices, such as tripped breakers or blown fuses that triggered each outage. Using the unique identifiers for these components, their GIS coordinates were retrieved and plotted to generate a heatmap of the outage density. Figure 3 presents the resulting heatmap, where the regions with higher outage concentrations are shown in red and yellow. This geospatial representation demonstrates clusters of vulnerability within the service territory. However, it is important to note that OMS records do not contain any weather measurements or meteorological context, the weather dataset mentioned in the previous subsection needs to be aligned to each OMS record.
Outage-restoration events extraction
To systematically analyze outage accumulation and restoration behavior, this work defines outage-restoration events based on the temporal progression of component outage records. Rather than independently evaluating each outage, outages are grouped into events that represent continuous disturbance intervals followed by full system recovery. As discussed in the Introduction section, restoration performance is not solely determined by the characteristics of a single outage, but is heavily influenced by the number and timing of coincident outages within a given time frame. When multiple outages occur in rapid succession, often triggered by severe weather, the restoration process becomes increasingly complex due to limited repair resources, unavoidable delays, and difficulty in arrangement. By aggregating temporally overlapping outages into outage events, this process will analyze how restoration time scales with the number of concurrent outages and provide a more realistic representation of system behavior under high system stress conditions.
An event begins with the first outage that occurs when all components are functional and ends when all outages have been restored, bringing the cumulative number of active outages, denoted as C(t), back to zero. Specifically, the process involves sorting all outage start and restoration times in chronological order and tracking C(t) at each time point. The value of C(t) increases when a new outage appears and decreases when an outage is restored. Each time C(t) returns to zero, the current event concludes, and any subsequent outage marks the start of a new event. For example, if an event includes n outage onsets, it must also contain n corresponding restorations to ensure that C(t) returns to zero at the end of the event window. This approach captures the cumulative behavior of coinciding outages and allows each event to be characterized by two primary features: the number of outages and the total restoration time, defined as the event restoration time from the first outage to the final restoration within the event. Figure 4 illustrates representative examples of extracted outage-restoration events. These plots illustrate how outages accumulate and are subsequently resolved during each event. The curves typically exhibit a sharp increase in the outage count at the beginning of an event, followed by a gradual decline as restorations are completed. The variation in shapes and durations reflects the diversity of event profiles, including both short, concentrated disruptions and longer, more complex restoration processes.
Note that in this study, an outage-restoration event is defined to end when the cumulative number of active outages returns to zero. This represents the strictest possible boundary condition and ensures that the entire period of disturbance and recovery is captured. We acknowledge that this definition may extend event durations and occasionally include background outages not directly related to the severe weather event, since utilities often experience a small number of routine outages even under normal conditions. In practice, utilities may prefer a more flexible threshold, such as defining event completion when 98% of outages have been restored or when the number of remaining outages falls below a small tolerance level. The proposed framework is compatible with such customizations, and the threshold can be adjusted according to utility preferences and operational standards. The strict criterion adopted here is used to demonstrate the methodology under the most conservative setting.
Delineation of weather zone
To capture the spatial variation in weather conditions across the service territory, the studied area is delineated into localized weather zones based on the distribution of NOAA weather stations. Specifically, two wind and six precipitation stations located within the region are used to distinguish wind and precipitation weather zones for resilience analyses. Each weather station serves as a reference point for one zone, ensuring that the weather data associated with each outage are drawn from the most geographically relevant source.
The division is accomplished using the Voronoi polygon method, a spatial partitioning technique that assigns every point in the region to its nearest weather station. Given a set of weather stations ({s_1, s_2, dots , s_n}) with known geographic coordinates, the Voronoi cell for station (s_i) consists of all points in the plane that are closer to (s_i) than to any other station (s_j), where (j ne i). This results in a tessellation of the area into non-overlapping polygons, each representing the area of influence of a particular weather station. The method is implemented using the QGIS software platform, which supports geospatial processing and visualization of shape files based on station coordinates.
Based on the spatial distribution of NOAA weather sensors and the measurement types available at each station, two wind zones and six precipitation zones were defined for the utility service region using the Voronoi polygon method. Wind zones are determined using the locations of stations that record wind-related features, such as hourly wind averages and gust speeds. The precipitation zones are defined using the locations of sensors that provide hourly rainfall, snowfall, and snow depth. The defined wind and precipitation zones are shown in Fig. 5. The left part shows the division of the service territory into two wind zones, each surrounding one of the two wind stations. The right part shows the division into six precipitation zones, each linked to one of the six precipitation stations.
Data-driven resilience models
This section introduces two models to quantify resilience across the distribution utility’s service territory. The first is a fragility model that correlates the number of outages with weather variables. The second is a restoration time model that relates the restoration time to the number of outages. These resilience metrics are subsequently quantified using real-world data from a utility.
Data-driven fragility models using severe weather outage events
A structured, multi-step process was followed to analyze system resilience against severe weather events. Each step was carefully designed to ensure the integration of weather records, outage data, and spatially defined weather zones into meaningful fragility models.
The first step involves compiling a dataset of historical severe weather records affecting the service area between 2004 and 2024. This dataset includes records classified by location, duration, and weather types such as high winds, tornadoes, floods, heavy snow, and thunderstorms. In the second step, all severe weather records are classified into two categories: wind-related events (e.g., tornadoes, high winds) and precipitation-related events (e.g., floods, snowstorms). This step classifies and associates the relevant weather variables, such as wind speed or precipitation levels, with each type of event. After that, each weather event is assigned to a defined weather zone based on the spatial coverage of the weather stations and the Voronoi polygon boundaries established earlier. Each event is matched to the zone in which it occurred, which supports the development of fragility curves reflecting the unique conditions of each zone. Then, the number of outages during each weather event is computed. This is done by filtering the outage dataset by event time window and geographic location, capturing only the outages that occurred within the event duration and the corresponding weather zone. In addition, we link each event to its corresponding weather measurements. For wind-related events, wind speed observations using the fastest 2-minute averages are extracted. For precipitation-related events, the hourly precipitation, snowfall, and snow depth are obtained. These values are aligned with the event temporal window to represent the intensity of the event. Finally, the collected data are aggregated at the zone level, yielding paired observations of weather intensity and outage impacts. These data are then used to construct fragility models, which express the number of outages as a function of weather severity. Separate fragility models are developed for wind and precipitation zones using wind and precipitation events, as their purpose is to characterize the relationship between weather intensity (e.g., wind speed or precipitation depth) and the number of outages resulting from those weather conditions. Exponential functions are used for model fitting, as they capture the nonlinear increase in outage likelihood with rising weather intensity.
Data-driven restoration time models using outage events
To characterize restoration performance across varying weather conditions, restoration time models are developed using the full set of outage-restoration events. These models aim to capture the general relationship between the number of outages and the total restoration time, regardless of the underlying cause, and therefore reflect the operational response characteristics across all types of outage conditions.
For each extracted event, as discussed in section “Outage-restoration Events Extraction”, two quantities are summarized: the total number of outages and the total restoration time. These values are plotted in scatter diagrams to explore the empirical relationship between the number of outages and the duration of restoration. Following this, events are grouped by weather zone, and separate restoration models are fitted for each zone. A combination of constant and double exponential functions is selected for its flexibility in capturing both the initial increase and the saturation effects observed in large-scale events.
This method produces a model for estimating restoration times across wind and precipitation zones using the number of outages predicted by the fragility models. By linking outage volume to restoration time in an event-specific manner, this method supports data-driven assessment of restoration performance under different severe weather conditions.
Fragility and restoration time models for wind events
To account for the impacts of wind events on the distribution system, zone-specific fragility and restoration time models are developed. In this study, fragility functions are defined at the zone level rather than for individual events. Each severe weather event that occurs within a zone contributes one aggregated observation, which represents the event’s weather intensity and the total number of outages it caused, to the zone’s fragility dataset. The resulting fragility curve for each zone is therefore fitted using multiple severe weather events accumulated over the 20-year record, reflecting the collective relationship between hazard intensity and outage volume rather than the behavior of any isolated event. Figure 6 displays the results for Wind Zone 0 and Wind Zone 1. The central map shows the spatial division of the two wind zones, with background shading representing the outage density throughout the study area. Wind Zone 0 covers the northern part of the region, while Wind Zone 1 covers the southern part.
The fragility model for Wind Zone 0 is shown in the upper left. The blue dots represent observed outages for individual wind events, plotted against maximum wind velocity (in m/s). The red curve shows the best-fit exponential function of the form (y = 0.0002e^{0.3675x}), where x is the wind speed and y is the number of outages. The curve demonstrates a rapid increase in outage counts once wind speeds exceed approximately 28 m/s, which is a threshold effect where system vulnerability intensifies significantly. This pattern reflects the relationship between outage numbers and wind speed in this zone. The corresponding restoration model for Wind Zone 0 is shown in the bottom left. Similarly, each blue dot represents a historical outage event, with the x-axis indicating the number of outages and the y-axis indicating the total restoration time in hours. The red curve represents the fitted model, a two-term exponential function that captures both the initial rapid increase in restoration time and the eventual saturation effect. This relationship shows that, as the outage volume increases, restoration becomes delayed, likely due to constraints in available repair crews and resource allocation.
The upper right panel presents the fragility model for Wind Zone 1. Compared to Zone 0, this zone exhibits a slightly different fragility profile. The fitted exponential model can be expressed as (y = 2.9214e^{0.1058x}), and this curve shows a more gradual increase in the outage count with wind speed. This indicates that Zone 1 may have relatively lower resilience against wind-related failures, or possibly differences in terrain or vegetation contributing to this trend. The figure on the bottom right shows the restoration model for Wind Zone 1. As in Zone 0, the restoration time increases nonlinearly with the outage volume, but the fitted curve here suggests a sharper increase at lower outage counts. This pattern may indicate less operational redundancy or more constrained access conditions in Zone 1. The model is defined by the expression (y = 232.60 – 217.17e^{-0.001x} – 15.22e^{-0.041x}).
The number of data points in each fragility curve is limited because severe weather events that satisfy the temporal and spatial matching criteria are relatively infrequent. Each such event yields only one valid observation per zone, as the outage dataset provides event-level total outages rather than continuous, asset-level failure counts. Only events with a clear overlap with NOAA severe weather records and the corresponding weather zone are included. This inherent sparsity of severe-weather observations is a well-recognized characteristic of empirical outage datasets and naturally results in a small number of points for fragility fitting.
Note that the blue data points in the fragility and restoration models represent different underlying datasets. For the fragility models, each point corresponds to a single severe-weather event within a specific weather zone and captures the relationship between weather intensity and the total number of outages caused by that event. Because severe-weather events are relatively infrequent and each event contributes only one aggregated observation, the resulting fragility curves contain a limited number of data points. In contrast, the blue points in the restoration-time models represent the full set of outages-restoration events extracted from the 20-year outage history, regardless of cause. These events capture the operational restoration behavior of the utility, including both weather-related and routine outages. Since restoration performance depends primarily on outage volume, rather than being exclusive to severe-weather events, the larger dataset enables the restoration model to generalize across diverse operating conditions.
Fragility and restoration time models for precipitation events
The utility sevice area has six precipitation zones, and Figure 7 presents the fragility and restoration models for each zone. The map in the lower right illustrates the boundaries of the six precipitation zones, and the background is the density of the outage records. In the fragility plots, blue dots represent observed outage counts during individual precipitation events, plotted against precipitation depth (in inches). The red curves correspond to the fitted exponential fragility models. The corresponding restoration time models are shown below or next to the fragility plots. Each blue point represents an outage event, with the x-axis showing the number of outages and the y-axis indicating the total restoration time in hours. The red curves represent fitted double-exponential functions. Although exact coefficients vary by zone, the general trend in all cases shows that restoration time increases nonlinearly with outage volume.
Although the fitted fragility curves for Zones 0, 1, 2, 3, and 5 share the same exponential form (y = 0.0654e^{2.7683x}), this does not imply that the outage levels in these zones are identical. The similarity in the curve shapes arises because many precipitation events affecting the area are spatially large and influence multiple precipitation zones simultaneously, resulting in similar precipitation-depth measurements for each affected zone. When aggregated at the event level, the paired observations of precipitation intensity and total outages fall along comparable ranges across these zones, causing the fitted exponential functions to converge. Nevertheless, the actual number of outages observed in each zone varies from event to event, as indicated by the blue data points in the restoration plots and the outage-density heat map. These differences reflect historical variation in exposure, infrastructure layout, and local vulnerability, even when the precipitation intensity is similar across zones.
Zone 4 shows a distinct fragility curve, modeled as (y = 1.179e^{1.6159x}), which grows more slowly than the fragility functions in the other zones. This may indicate lower sensitivity to precipitation depth, possibly due to reduced exposure, fewer vulnerable components, or differences in system configuration. The restoration model for Zone 4 also shows a steeper increase in duration with increasing outage count, showing longer recovery periods under stress conditions. For Zone 5, while the fragility model is identical to that of Zones 0–3, the restoration curve deviates. The fitted model indicates a slower increase in restoration time at lower outage volumes, followed by a steeper climb once the number of outages exceeds approximately 100. This behavior may reflect the threshold of repair resources.
It is important to mention that precipitation-driven outages can arise from different mechanisms associated with rain, snow, or mixed precipitation. However, the number of snow-only or rain-only severe events within each zone is insufficient to support independent fragility models for each precipitation type. In this work, all precipitation-driven events are therefore aggregated to construct a single precipitation fragility curve per zone. While this may introduce additional variability in the fitted functions, the aggregation is necessary to maintain statistical robustness given the available data. Future work could incorporate separate rain and snow fragility models when higher-resolution or longer-term datasets are available.
Model performance
To evaluate the accuracy of the proposed framework, we conduct a validation using historical severe-weather events. For each event, the recorded weather intensity is used as input to the fragility model to estimate the number of outages, and the predicted outage count is then used in the restoration-time model to estimate the total event duration. These predicted values are compared with their historical counterparts, and accuracy is quantified using goodness-of-fit metrics, including the coefficient of determination ((R^2)) for both the fragility and restoration models. The reported (R^2) values in Table 1 show that the fitted models capture the major trends in the outage data, providing a consistent and data-driven basis for resilience analysis.
Visualization of resilience metrics
The developed fragility and restoration time models can be combined to generate zone-specific predictions of outage restoration time under a given weather scenario. For each target weather condition, such as wind velocity (m/s) for a wind event or precipitation depth (inches) for a precipitation event, the fragility model is used first to estimate the expected number of outages in each zone. Specifically, the wind or precipitation level is input into each zone’s corresponding exponential fragility model, yielding an estimated outage count for that scenario. The predicted number of outages is then input into the corresponding restoration time model. The restoration model maps the outage count to an expected total restoration time. This two-step process estimates the restoration time in each zone, given a particular level of wind or precipitation. Applying this procedure across all zones generates a complete set of restoration time estimates for the entire service area. The results are visualized on a spatial map, with each zone shaded according to its predicted restoration time under the specified weather conditions. These visualizations directly compare resilience between zones and help identify areas more vulnerable to specific weather conditions.
Figure 8a presents an example of a wind event with a velocity of 35 m/s. In this visualization, darker shading indicates shorter predicted restoration durations and thus higher resilience. As shown in the figure, Wind Zone 0 exhibits a shorter expected restoration time compared to Zone 1 under the same wind intensity, indicating a stronger resilience performance. Figure 8b shows the restoration performance for a precipitation event with 2.5 inches of rainfall. As the map illustrates, Zones 0 and 2 demonstrate relatively shorter restoration times, indicating higher resilience to precipitation-driven outages, while Zones 4 and 5 exhibit longer restoration durations and greater vulnerability. This spatial comparison can help utilities target specific zones for resilience improvement efforts.
Discussion
The framework presented in this study offers a utility-oriented approach to resilience quantification that emphasizes accessibility, clarity, and ease of implementation. Unlike methods that rely on simulation environments or advanced machine learning architectures, the proposed approach is built directly from historical outage and weather records that utilities already maintain. This design makes the tool practical and widely deployable without requiring specialized modeling infrastructure.
A major strength of the framework is its interpretability. Both the fragility and restoration models are constructed through transparent, data-driven relationships that clearly illustrate how weather intensity and outage volume shape system impacts. These simple and editable formulations allow utility engineers and planners to understand, validate, and communicate the results without relying on opaque methods. This transparency is essential for supporting utility operational needs and long-term planning.
While outage volume is a primary driver of restoration duration, we acknowledge that restoration performance is also influenced by other factors, such as crew availability and staging, access constraints, hazard conditions, and operational restoration strategies. These variables can influence the actual pace of repairs, but are not included explicitly in the present framework. Explicitly incorporating these variables is challenging because such operational records are typically sparse, inconsistent across utilities, or unavailable over long historical periods. However, a key advantage of the data-driven approach adopted in this work is that these factors are inherently ingrained in the historical restoration times used to fit the model. Each restoration duration implicitly reflects the combined effects of crew mobilization, logistical constraints, and on-site conditions. Consequently, although these operational drivers are not modeled explicitly, their influence is captured through the empirical restoration-time data, and the resulting variability appears in the scatter around the fitted restoration curve. This approach allows the framework to remain practical and widely applicable while still reflecting the aggregate operational behavior observed in real utility systems.
Another benefit of the framework is its alignment with real-world operational constraints. By partitioning the service territory into weather zones based on sensor availability and geographic coverage, the method accounts for spatial variability and enables localized resilience assessment. The outputs-zone-level fragility patterns, restoration behavior, and resilience maps-offer utilities actionable insights for targeted hardening, outage planning, and resource allocation. The method leverages only data that utilities already collect, minimizing cost and integration barriers. Although exponential fragility functions increase rapidly with hazard intensity, the overall resilience framework incorporates several mechanisms that ensure practical and physically meaningful behavior even for storms more severe than those historically observed. First, the restoration-time model introduces a natural saturation effect that reflects operational limits on repair resources, which prevents unrealistically large outage projections from translating into unbounded restoration durations. Second, utilities can impose physical caps based on the number of devices or customers in each zone, ensuring that predicted outage volumes remain consistent with system characteristics. Third, because the fragility functions are fully data-driven, they can be continually updated as new severe-weather events occur, allowing the models to evolve with changing storm patterns. These features enable the framework to remain robust under extreme conditions while preserving the simplicity and data accessibility required for utility deployment.
Despite these strengths, several limitations remain. The accuracy of the framework depends on the availability and quality of historical outage records, and the number of severe-weather events in each zone may be limited. The zonal representation captures broad spatial variations in weather exposure but does not incorporate finer-grained differences in vegetation patterns, infrastructure conditions, or network topology that may influence outage susceptibility or restoration effort.
The present study models wind- and precipitation-driven fragility separately due to the limited number of severe-weather events available in each zone. With only a small set of extreme events over the past two decades, it is not yet feasible to reliably estimate multidimensional fragility functions that simultaneously account for interacting hazards, such as wind, rain, snow, or freezing conditions. However, as more extreme-weather data becomes available, either through the accumulation of future events or through regional data aggregation, multi-dimensional fragility modeling becomes a practical extension. In such cases, outage severity could be represented as a function of multiple concurrent hazard variables, enabling the framework to quantify the joint effects of simultaneous hazards. This extension would enhance the physical richness of the fragility representation while maintaining the data-driven, utility-focused nature of the framework.
Although the number of severe-weather events available in the historical dataset can be limited, particularly for smaller utilities or regions with relatively mild climates, the proposed framework remains broadly applicable because it relies only on routinely collected outage records and basic weather observations. When outage data are sparse, utilities may supplement their datasets by collaborating with neighboring or peer utilities that share similar design practices, vegetation characteristics, and regional weather patterns. In addition, state or regional reliability authorities can aggregate outage data across multiple utilities to develop more statistically robust resilience metrics. It is also important to recognize that historical outage data represent a pragmatic sample of what has occurred and cannot capture all rare or unprecedented events, especially as some hazards may become more frequent and severe under a warming climate. These considerations highlight the need for multiple complementary approaches to resilience assessment. The data-driven framework developed in this work offers a practical basis for extracting resilience metrics directly from utility data and can serve as a valuable tool for informing resilience investments and preparedness planning.
In summary, the proposed framework provides a practical and scalable foundation for resilience assessment in distribution systems. By grounding the analysis in operational data, aligning with utility planning needs, and remaining extensible to multi-hazard and regional data contexts, this work contributes a sustainable methodology for quantifying and visualizing resilience under extreme weather conditions.
Data availability
The data that support the findings of this study are available from the corresponding author upon reasonable request.
Code availability
References
-
Stanković, A. M. et al. Methods for analysis and quantification of power system resilience. IEEE Trans. Power Syst.38, 4774–4787 (2023).
-
Newman, R. & Noy, I. The global costs of extreme weather that are attributable to climate change. Nat. Commun.14, 6103 (2023).
-
Ji, C. et al. Large-scale data analysis of power grid resilience across multiple us service regions. Nat. Energy1, 1–8 (2016).
-
Panteli, M., Trakas, D. N., Mancarella, P. & Hatziargyriou, N. D. Power systems resilience assessment: Hardening and smart operational enhancement. Proc. IEEE105, 1202–1213 (2017).
-
Rao, S., Scaggs, S. A., Asuan, A. & Roque, A. D. Power outages and social vulnerability in the us gulf coast: Multilevel Bayesian models of outage durations amid rising extreme weather. Human. Soc. Sci. Commun.12, 1–12 (2025).
-
Stankovic, A. M. et al. Methods for analysis and quantification of power system resilience. IEEE Trans. Power Syst.38, 4774–4787 (2023).
-
Carrington, N. K., Dobson, I. & Wang, Z. Extracting resilience metrics from distribution utility data using outage and restore process statistics. IEEE Trans. Power Syst.36, 5814–5823 (2021).
-
Ouyang, M. & Wang, Z. Resilience assessment of interdependent infrastructure systems: With a focus on power-grid-transportation systems. Reliab. Eng. Syst. Saf.141, 74–82. https://doi.org/10.1016/j.ress.2015.03.011 (2015).
-
Panteli, M. & Mancarella, P. Influence of extreme weather and climate change on the resilience of power systems: Impacts and possible mitigation strategies. Electr. Power Syst. Res.127, 259–270. https://doi.org/10.1016/j.epsr.2015.06.012 (2015).
-
Panteli, M., Trakas, D., Mancarella, P. & Hatziargyriou, N. Power systems resilience assessment: Hardening and smart operational enhancement. Proc. IEEE105, 1202–1213. https://doi.org/10.1109/JPROC.2017.2691357 (2017).
-
Kaloti, S. A. & Chowdhury, B. H. Toward reaching a consensus on the concept of power system resilience: Definitions, assessment frameworks, and metrics. IEEE Access11, 81401–81418. https://doi.org/10.1109/ACCESS.2023.3293565 (2023).
-
Xu, L. & Brown, R. Undergrounding Assessment Phase 3 Report: Ex Ante Cost and Benefit modeling (Quanta Technology, Raleigh, 2008).
-
Dunn, S., Wilkinson, S., Alderson, D., Fowler, H. & Galasso, C. Fragility curves for assessing the resilience of electricity networks constructed from an extensive fault database. Nat. Hazard. Rev.19, 04017019 (2018).
-
Reed, D. A. Electric utility distribution analysis for extreme winds. J. Wind Eng. Ind. Aerodyn.96, 123–140 (2008).
-
Donaldson, D. L. et al. Enhancing power distribution network operational resilience to extreme wind events. Meteorol. Appl.30, e2127 (2023).
-
Murray, K. & Bell, K. R. Wind related faults on the gb transmission network. In Proceedings International Conference on Probabilistic Methods Applied to Power Systems 1–6 (2014).
-
Bjarnadottir, S., Li, Y. & Stewart, M. G. Hurricane risk assessment of power distribution poles considering impacts of a changing climate. J. Infrastruct. Syst.19, 12–24 (2013).
-
Liu, H., Davidson, R. A. & Apanasovich, T. V. Spatial generalized linear mixed models of electric power outages due to hurricanes and ice storms. Reliab. Eng. Syst. Saf.93, 897–912 (2008).
-
Al Mamun, A., Zenkri, O., Madasthu, S., Cox, R. & Chowdhury, B. Outage data analytics for correlating resilience and reliability. In Proceedings of North American Power Symposium 1–6 (2023).
-
Davidson, R. A., Liu, H., Sarpong, I. K., Sparks, P. & Rosowsky, D. V. Electric power distribution system performance in Carolina hurricanes. Nat. Hazard. Rev.4, 36–45 (2003).
-
Ahmad, A. & Dobson, I. Towards using utility data to quantify how investments would have increased the wind resilience of distribution systems. IEEE Trans. Power Syst.39, 5956–5967 (2024).
-
Arif, A. et al. Optimizing service restoration in distribution systems with uncertain repair time and demand. IEEE Trans. Power Syst.33, 6828–6838 (2018).
-
Tan, Y., Das, A. K., Arabshahi, P. & Kirschen, D. S. Distribution systems hardening against natural disasters. IEEE Trans. Power Syst.33, 6849–6860 (2018).
-
Tan, Y. et al. Scheduling post-disaster repairs in electricity distribution networks. IEEE Trans. Power Syst.34, 2611–2621 (2019).
-
Jaech, A., Zhang, B., Ostendorf, M. & Kirschen, D. S. Real-time prediction of the duration of distribution system outages. IEEE Trans. Power Syst.34, 773–781 (2019).
-
Cerrai, D. et al. Predicting storm outages through new representations of weather and vegetation. IEEE Access7, 29639–29654 (2019).
-
Kezunovic, M., Obradovic, Z., Djokic, T. & Roychoudhury, S. Systematic framework for integration of weather data into prediction models for the electric grid outage and asset management applications. In Proceedings of the 51st Hawaii International Conference on System Sciences 2737–2746 (2018).
-
National Oceanic and Atmospheric Administration: National Centers for Environmental Information. Climate data online search. https://www.ncdc.noaa.gov/cdo-web/search. Accessed 01 Aug 2025.
-
National Oceanic and Atmospheric Administration: National Centers for Environmental Information. Storm events database. https://www.ncei.noaa.gov/stormevents/. Accessed 01 Aug 2025.
Funding
This work was partially supported by the Power System Engineering and Research Center under Grant PSERC S-110, the U.S. Department of Energy’s Office of Electricity under the award Number DE-OE0000986, and the National Science Foundation under Grant ECCS 2042314. The funders had no role in the design of the study, data collection, analysis, interpretation, or writing of the manuscript.
Authors and Affiliations
Contributions
S.M. and Z.W. conceived the experiments, D.W., L.L., and J.Z. conducted the experiments, D.W. and S.M. analyzed the results. D.W. and S.M. prepared the manuscript, and all authors reviewed it.
Ethics declarations
Competing interests
The authors declare no competing interests.
Additional information
Publisher’s note
Springer Nature remains neutral with regard to jurisdictional claims in published maps and institutional affiliations.
Rights and permissions
Open Access This article is licensed under a Creative Commons Attribution-NonCommercial-NoDerivatives 4.0 International License, which permits any non-commercial use, sharing, distribution and reproduction in any medium or format, as long as you give appropriate credit to the original author(s) and the source, provide a link to the Creative Commons licence, and indicate if you modified the licensed material. You do not have permission under this licence to share adapted material derived from this article or parts of it. The images or other third party material in this article are included in the article’s Creative Commons licence, unless indicated otherwise in a credit line to the material. If material is not included in the article’s Creative Commons licence and your intended use is not permitted by statutory regulation or exceeds the permitted use, you will need to obtain permission directly from the copyright holder. To view a copy of this licence, visit http://creativecommons.org/licenses/by-nc-nd/4.0/.
About this article
Cite this article
Wang, D., Maharjan, S., Zheng, J. et al. Data-driven quantification and visualization of resilience metrics of power distribution systems.
Sci Rep16, 6334 (2026). https://doi.org/10.1038/s41598-026-37040-w
-
Version of record:13 February 2026
-
DOI
:https://doi.org/10.1038/s41598-026-37040-w
Keywords
- Distribution system outages
- Power grid resilience
- Outage restoration time prediction
