

Abstract
This study proposes an Adaptive Genetic Algorithm (AGA) model for predicting training load in fencing. Training load is defined using external mechanical load collected from sensors and is categorized into six components: strength, aerobic, capacity, endurance, speed, agility, and flexibility. The study employs the publicly available Daily and Sports Activities dataset, which includes data from eight healthy adults (four females and four males, aged 20–30) performing 19 types of activities. Time-series segments are mapped to fencing-related load patterns for model training and evaluation. The proposed AGA dynamically adjusts the fitness function, crossover rate, and mutation rate. Its performance is compared with several models, including Deep Neural Network with Gated Recurrent Unit (DNN-GRU), Extreme Gradient Boosting (XGBoost), Long Short-Term Memory with Attention Mechanism (LSTM-Attn), Event Adversarial Neural Network (EANN), and Temporal Attention Graph Convolutional Network (TA-GCN). The results show that the AGA consistently outperformed all comparison methods in terms of prediction error and goodness-of-fit. For example, in endurance load prediction, the test set achieves an R2 of 0.97 and an accuracy of 0.96. Time-series visualizations are used to analyze typical and extreme load segment, where extreme load is defined as time windows in which the predicted external load falls within the top decile. Overall, the findings demonstrate that the optimized AGA framework provides reliable training load predictions while maintaining computational efficiency. This approach offers a practical reference for data-driven training monitoring and training planning in fencing and related sports.
Subjects
- Engineering
- Mathematics and computing
Introduction
Fencing is a high-intensity intermittent combat sport, and its sport-specific training load exhibits distinct physiological and technical characteristics. These characteristics include frequent rapid accelerations and decelerations, instantaneous impact loads during lunging attacks, and long-term asymmetrical movement patterns resulting from dominant sword-hand usage1,2. Such factors lead to highly variable training loads and may increase injury risk due to cumulative fatigue and the development of musculoskeletal asymmetry3,4. Consequently, monitoring and predicting sport-specific training loads is essential for the scientific design of training programs. At present, assessments of fencing training load often rely on subjective experience or single indicators, such as heart rate or training duration. These approaches fail to fully capture high-frequency directional changes and asymmetrical force application inherent in fencing movements5. In complex training cycles, objective and quantifiable prediction tools are therefore required to support effective load management. Genetic algorithms have demonstrated advantages in training load modeling; however, they are susceptible to local optima and slow convergence, which limits their predictive performance under multi-factor conditions6. Adaptive genetic algorithms (AGAs) partially address these limitations by dynamically adjusting crossover and mutation rates, thereby improving parameter optimization efficiency and model stability7. In addition, data visualization techniques can reveal temporal characteristics of training load, including micro-cycle fluctuations and peak intervals during key training sessions, providing valuable references for training plan adjustment. Based on these considerations, this study constructs an AGA-based model to predict fencing-specific training loads and integrates visualization methods to illustrate load variation trends. The study aims to provide technical support for objective monitoring and prediction of fencing training loads, as well as methodological guidance for load management in similar high-intensity intermittent sports.
Literature review
Before constructing a training load prediction model for fencing, it is necessary to review related research from three perspectives: training load theory, sport-specific load monitoring, and AGAs methods.
Regarding training load theory, Impellizzeri et al. (2023) suggested that training load could be characterized using a “training impulse–physiological adaptation” dynamic equation. Training load is defined as the combined effect of external load (e.g., training volume, intensity, session structure) and internal load (e.g., heart rate, blood lactate, perceived exertion). The physiological response is considered the result of superimposed adaptation and fatigue processes, providing a foundational perspective for quantitative load modeling8. Pedersen et al. (2023) found that multiplying perceived exertion scores by training duration could effectively quantify daily training load. They further assessed monotony and training stress indices to evaluate overload risk and injury potential, establishing a general monitoring approach applicable across sports9. In fencing-specific load monitoring, Di-Martino et al. (2024) demonstrated that synchronously collecting heart rate and triaxial acceleration data could reveal the rapid acceleration–deceleration patterns and high-frequency start–stop characteristics during forward–backward steps, lunging attacks, and sudden directional changes. Different session types (technical drills, combat training, simulated competition) showed significant differences in heart rate distribution and mechanical load peaks, providing empirical evidence for temporal analysis of fencing training load10. Niță and Magyar (2023) reported that combining mechanomyography with isokinetic muscle testing could assess neuromuscular fatigue and functional asymmetry between the sword-dominant and non-dominant lower limbs. Frequent lunges and unilateral dominance alter the recovery rhythm of flexor–extensor muscle groups and are closely associated with increased injury risk. These findings suggest that asymmetrical movement patterns and neuromuscular indicators should be considered in fencing training load prediction models11. In the area of training load prediction and data analysis, Yıldırım et al. (2023) demonstrated that integrating heart rate, movement counts, training density, and recovery intervals could build individualized load prediction models, with high consistency between predicted and actual physiological responses. This approach supports the design of hierarchical and periodized training plans12. Tona et al. (2023) found that incorporating time-series curves, overlapping interval plots, and threshold markers into visualization techniques helped coaches quickly identify peak load intervals and insufficient recovery phases. These techniques improved the interpretability of model outputs and enhanced decision-making efficiency13. Regarding algorithms and optimization methods, Cao and Luan (2024) showed that, compared with traditional AGA that adjusted parameters solely based on algebraic or fitness changes, mutation mechanisms based on population diversity feedback and hierarchical elite retention strategies effectively prevented premature convergence and improved global search ability in multimodal, strongly nonlinear problems14. Wang (2025) reported that AGAs were combined with parallel computing frameworks. Parallel evolution and information exchange among subpopulations were used in this approach. This combination maintained solution diversity, reduced convergence time, and improved stability and computational efficiency in training load prediction and parameter optimization applications15.
Overall, classical training load theory provides a foundation for modeling the “external load–internal load–functional change” relationship. Fencing-specific load monitoring offers solid physiological and biomechanical guidance for indicator selection. Improvements in adaptive and hybrid genetic algorithms provide tools for enhancing convergence performance and global search ability. However, existing studies rarely integrate fencing-specific physiological requirements and monitoring indicators into AGA-based load prediction models. The coupling mechanisms between indicators such as heart rate, acceleration, neuromuscular fatigue, and algorithm structure remain underexplored. Based on these considerations, this study introduces an improved AGA and visualization methods to construct a training load prediction model that balances algorithm performance with fencing-specific features, aiming to address gaps in the current literature.
Research analysis
Implementation of the AGA
The AGA represents an evolution of the traditional GA, specifically designed to enhance adaptability across different evolutionary stages. This improvement is achieved through dynamic adjustments of key parameters, such as crossover and mutation rates, which address common limitations observed in traditional GAs, including premature convergence to local optima and slow convergence speeds. The core implementation process of AGA retains structural similarities with traditional GAs, encompassing several fundamental steps as outlined in Table 1:
The AGA enhances performance across different evolutionary stages through dynamic adjustments of the crossover and mutation rates, thereby adapting to varying optimization phases. In the initial evolutionary stages, a higher crossover rate facilitates a broad exploration of the solution space, strengthening global search capabilities and accelerating the discovery of diverse potential solutions. As the algorithm progresses towards later stages, the crossover rate is gradually reduced to minimize disruptions to high-quality individuals, thereby enhancing local search precision and convergence stability17,18,19. The dynamic adjustment of the crossover rate is expressed by Eq. (1):
$$:{varvec{P}}_{varvec{c}}={varvec{P}}_{varvec{c}varvec{m}varvec{a}varvec{x}}-frac{({varvec{P}}_{varvec{c}varvec{m}varvec{a}varvec{x}}-{varvec{P}}_{varvec{c}varvec{m}varvec{i}varvec{n}})cdot:varvec{t}}{varvec{T}}$$
(1)
In Eq. (1), (:{varvec{P}}_{varvec{c}varvec{m}varvec{a}varvec{x}}) and (:{varvec{P}}_{varvec{c}varvec{m}varvec{i}varvec{n}}) represent the maximum and minimum crossover rates, respectively. The variable (:varvec{t}) denotes the current iteration number, while (:varvec{T}) refers to the maximum number of iterations. The crossover rate (:{varvec{P}}_{varvec{c}}) dynamically decreases as the number of iterations increases, promoting a gradual transition from global exploration to local exploitation. The mutation rate is also dynamically adjusted to maintain a balance between population diversity and convergence speed. In scenarios where population diversity is low, an elevated mutation rate is introduced to prevent premature convergence to local optima, thereby sustaining the algorithm’s exploratory capacity. As the population approaches convergence and diversity decreases further, the mutation rate is progressively reduced to stabilize solution quality and prevent unnecessary perturbations. The dynamic adjustment of the mutation rate is defined by Eq. (2):
$$:{varvec{P}}_{varvec{m}}={varvec{P}}_{varvec{m}varvec{i}varvec{n}}+frac{({varvec{P}}_{varvec{m}varvec{a}varvec{x}}-{varvec{P}}_{varvec{m}varvec{i}varvec{n}})cdot:(1-varvec{D})}{1+{varvec{e}}^{-varvec{alpha:}cdot:(varvec{D}-0.5)}}$$
(2)
In Eq. (2), (:{varvec{P}}_{varvec{m}varvec{a}varvec{x}}) and (:{varvec{P}}_{varvec{m}varvec{i}varvec{n}}) denote the maximum and minimum mutation rates, respectively, while (:varvec{D}) represents the population diversity, calculated based on genetic variation within the population. The parameter (:varvec{alpha:}) serves as a control factor, regulating the sensitivity of the mutation rate to fluctuations in diversity. This dynamic adjustment mechanism ensures that the mutation rate remains adaptive to the evolving characteristics of the population, promoting both diversity maintenance and convergence efficiency. To mitigate the risk of generating low-quality initial populations, heuristic methods are utilized to produce a subset of individuals with enhanced distribution quality. This approach ensures that the initial solutions are more diverse and representative of the broader solution space, thereby improving the algorithm’s overall search efficiency from the outset. Additionally, during each iteration, the current optimal solution is directly retained in the next generation. This elitism strategy safeguards high-quality solutions from being lost due to stochastic genetic operations, thereby maintaining solution stability across generations20,21,22. Real-time monitoring of the population’s genetic diversity is implemented to track the evolutionary process. When diversity metrics fall below a predefined threshold, indicating a risk of premature convergence, mutation operations are intensified to introduce greater variability. Alternatively, new individuals are introduced to the population to rejuvenate genetic diversity, thereby sustaining the algorithm’s exploration capability.
The AGA improved global search capability and accelerated convergence by dynamically adjusting crossover and mutation rates, incorporating optimized fitness functions, and applying diversity control strategies. These methodological enhancements provide a solid basis for subsequent experiments, particularly in predicting fencing training load, where capturing complex and dynamic patterns is essential23.
Optimization of the AGA
Improving the efficiency and performance of the AGA in predicting fencing training load involved optimizing key algorithmic components, including the fitness function, crossover and mutation strategies, and both convergence speed and global search capability.
The fitness function serves as the core mechanism for evaluating individual solution quality within the genetic algorithm framework. Traditional fitness functions often exhibit limitations in capturing the complexities of nonlinear optimization problems, leading to premature convergence toward local optima. To address this issue, the fitness function is optimized through the introduction of a dynamic fitness weighting mechanism, which adjusts weight coefficients in response to problem-specific characteristics:
$$:varvec{F}left(varvec{i}right)={varvec{omega:}}_{1}cdot:{varvec{f}}_{1}left(varvec{i}right)+{varvec{omega:}}_{2}cdot:{varvec{f}}_{2}left(varvec{i}right):::::$$
(3)
In Eq. (3), (:varvec{F}left(varvec{i}right)) represents the fitness function, (:{varvec{omega:}}_{1}) and (:{varvec{omega:}}_{2}) are dynamically adjusted weighting coefficients, and (:{varvec{f}}_{1}left(varvec{i}right)) and (:{varvec{f}}_{2}left(varvec{i}right)) denote objective functions reflecting different performance metrics. The adjustment of weights is guided by the evolutionary stage of the algorithm and the observed trends in objective function performance. To further mitigate premature convergence, a penalty factor is incorporated into the fitness evaluation, reducing the fitness of individuals that violate predefined constraints. This approach promotes a more directed optimization process, enhancing the algorithm’s capacity to explore feasible regions of the solution space effectively24.
Crossover and mutation operations are critical to generating new solutions and maintaining genetic diversity within the population. The crossover rate is dynamically modulated based on the fitness of individual solutions to balance exploration and exploitation effectively:
$$:{varvec{P}}_{varvec{c}}left(varvec{i}right)=left{begin{array}{c}{varvec{P}}_{varvec{c}varvec{m}varvec{a}varvec{x}}-({varvec{P}}_{varvec{c}varvec{m}varvec{a}varvec{x}}-{varvec{P}}_{varvec{c}varvec{m}varvec{i}varvec{n}})cdot:frac{varvec{F}left(varvec{i}right)}{{varvec{F}}_{varvec{a}varvec{v}varvec{g}}}\:{varvec{P}}_{varvec{c}varvec{m}varvec{a}varvec{x}},hspace{0.25em}hspace{0.25em}hspace{0.25em}hspace{0.25em}hspace{0.25em}end{array}right.$$
(4)
In Eq. (4), (:{varvec{F}}_{varvec{a}varvec{v}varvec{g}}) represents the average fitness of the population, (:{varvec{P}}_{varvec{c}}left(varvec{i}right)) denotes the dynamically adjusted crossover probability for the -th individual.
To complement the crossover strategy, a non-uniform mutation operation is introduced. The mutation probability decreases gradually as the algorithm progresses, allowing for more aggressive exploration in the early stages and refined local searches in later iterations:
$$:{varvec{P}}_{varvec{m}}left(varvec{i}right)={varvec{P}}_{varvec{m}varvec{a}varvec{x}}cdot:(1-frac{varvec{t}}{varvec{T}}{)}^{varvec{alpha:}}$$
(5)
Enhancing population diversity and preventing premature convergence are critical objectives in optimizing the AGA. To achieve these goals, the number of crossover and mutation points is increased, while elite individuals are retained to preserve high-quality solutions. Addressing the challenges of slow convergence and susceptibility to local optima, the individual with the highest fitness is directly preserved during each iteration. This elite retention strategy ensures that the optimal solution is not lost and improves the stability of algorithm convergence. To enhance local search precision without compromising global search capabilities, local search algorithms such as simulated annealing and particle swarm optimization are integrated into the genetic algorithm framework. This hybrid approach leverages the global exploration strength of the genetic algorithm and the fine-tuning capabilities of local search methods. Additionally, parallel computing techniques are employed to accelerate the evaluation of populations, as well as crossover and mutation operations, thereby significantly reducing the algorithm’s runtime and improving computational efficiency. The key features of the optimized algorithm are summarized in Table 2.
Through the optimization of the fitness function, crossover and mutation strategies, and improvements in convergence speed and global search capability, the performance of the AGA in predicting fencing training load is significantly enhanced. These optimizations strengthen the algorithm’s search capabilities, improve adaptability to complex nonlinear problems, and establish a robust foundation for subsequent experimental validation and practical applications.
Experimental design
The dataset used in this experiment was the Daily and Sports Activities Dataset, which includes data from 19 distinct daily and sports activities performed by eight participants (four females and four males) aged 20 to 30 years. Each activity lasted five minutes and was segmented into five-second intervals, resulting in 480 signal segments per activity. The recorded activities included sitting, standing, lying down, stair climbing (ascending and descending), remaining stationary or moving within an elevator, walking in a parking lot, walking and running on a treadmill, and using various fitness equipment. The dataset is publicly available at: https://archive.ics.uci.edu/dataset/256/daily+and+sports+activities.
Although the Daily and Sports Activities Dataset is not specific to fencing, it possesses several features highly relevant to modeling fencing training load. First, the dataset continuously records time-series signals of various daily and sports activities using wearable sensors. Each activity is segmented into 5-second windows, producing a large number of multi-segment activity samples. This “multiple activity types + continuous time windows” structure resembles the temporal alternation of different session types in actual fencing training (e.g., technical drills, footwork exercises, combat simulations), where load fluctuates within short time windows. This makes the dataset suitable for evaluating the modeling capability of AGAs on intermittent, non-stationary motion signals. Second, the dataset includes a wide range of movement patterns, such as sitting, standing, walking, running, stair climbing, and machine-based exercises. These cover a continuum from low-intensity static postures to moderate- and high-intensity cyclical movements. Although these activities do not represent fencing-specific techniques, their mechanical load patterns and metabolic responses can serve as proxies for “low-load maintenance,” “moderate-intensity reciprocal movement,” and “high-intensity limb-driven” activity types. This provides a controllable and open environment for constructing a mapping between external load features and load-type labels. The core objective of this study is to validate the feasibility and performance of the improved AGA in complex exercise load prediction tasks. Therefore, using a publicly available and well-structured dataset facilitates methodological verification under reproducible conditions and lays the foundation for subsequent transfer to actual fencing data.
For analytical clarity, the dataset was classified into three dimensions based on activity type: strength training, aerobic training, and endurance training. This classification is not arbitrary. It is based on distinctions in energy metabolism and movement characteristics of different load patterns in exercise physiology. Activities that primarily involve large muscle groups overcoming gravity or external resistance, with short bursts of high tension, were classified as “strength training.” These physiological characteristics resemble the short explosive movements in fencing, such as lunging initiations and rapid directional changes. Activities of moderate intensity with rhythmic, cyclical motion and predominantly aerobic energy supply, such as walking or light jogging, were classified as “aerobic training.” These correspond to longer periods of low- to moderate-intensity reciprocal footwork in fencing. Activities with longer duration that place higher demands on cardiovascular endurance and muscular stamina were classified as “endurance training,” reflecting the regulation of cumulative load and recovery rhythms in training plans. These three categories are not intended to prescribe fencing-specific training directly. Instead, they serve as label spaces for supervised learning, allowing evaluation of whether the improved AGA can distinguish load types of different intensities and patterns within the same dataset. The focus of this study is on the algorithm’s sensitivity to load patterns and prediction accuracy, rather than on prescribing specific training programs. Using general load classifications at a macro level maintains correspondence with classical training load theory (e.g., external load/internal load, intensity–time structure) and provides a unified framework for later transfer of the model to fencing-specific data.
To ensure experimental consistency and reproducibility, the hardware configuration is specified as follows:
Processor: Intel Xeon Silver 4216.
Graphics Card: NVIDIA A100.
Memory: Samsung 128GB DDR4.
Storage Device: Samsung 970 EVO Plus NVMe SSD.
Power Supply: Corsair RM850x.
The experimental parameters are configured as follows:
Population size: 50.
Maximum generations: 100.
Crossover and mutation probabilities: Dynamically adjusted based on fitness and diversity metrics.
Objective function weights: (0.3, 0.7) to balance multi-objective optimization.
Penalty factor: 10, applied to constrain violations in optimization.
Elite individual proportion: 10%, ensuring the retention of top-performing solutions.
Random seed: 42, to maintain result reproducibility.
Comparative models employed in the experiment include:
Deep Neural Network – Gated Recurrent Unit (DNN-GRU).
Extreme Gradient Boosting (XGBoost).
Long Short-Term Memory with Attention Mechanism (LSTM-Attn).
Event Adversarial Neural Network (EANN).
Temporal Attention Graph Convolutional Network (TA-GCN).
These models encompass a diverse array of methodologies, ranging from deep learning and ensemble learning to graph neural networks. This diversity ensures comprehensive benchmarking, providing a robust framework for evaluating the performance of the optimized AGA in comparison to state-of-the-art predictive models.
Experimental evaluation of the AGA
Performance analysis
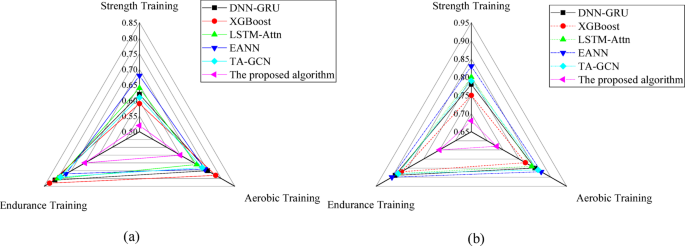
The experimental evaluation encompasses four key dimensions: predictive performance, convergence efficiency, robustness, and generalization capability. Each dimension is quantified using two evaluation metrics to ensure comprehensive assessment. For predictive performance, mean absolute error (MAE) and root mean squared error (RMSE) serve as the primary indicators. The corresponding experimental results are illustrated in Fig. 1.
As shown in Fig. 1(a), in the MAE analysis, the optimized AGA exhibits superior predictive accuracy across all three training categories. The MAE values are recorded at 0.52 for strength training, 0.65 for aerobic training, and 0.70 for endurance training. These results reflect a notable reduction in prediction errors compared to benchmark models. Specifically, DNN-GRU demonstrates an MAE of 0.62 in strength training, while LSTM-Attn records an MAE of 0.80 in endurance training, and EANN achieves an MAE of 0.74 in aerobic training. Figure 1(b) shows that regarding the RMSE metric, the optimized model achieves values of 0.68 for strength training, 0.73 for aerobic training, and 0.75 for endurance training. These results indicate substantial improvements in prediction accuracy, highlighting the model’s capability to minimize large deviations. In comparison, XGBoost reports an RMSE of 0.75 for strength training, and TA-GCN records an RMSE of 0.88 for endurance training, underscoring the performance gap between the optimized algorithm and traditional models. To further assess the statistical advantage of the optimized AGA model over the baseline TA-GCN, paired t-tests and Wilcoxon signed-rank tests were conducted to evaluate differences in MAE and RMSE across three types of training load: strength, aerobic, and endurance. The results are presented in Table 3.
As shown in Table 3, for all six comparisons of MAE and RMSE, the paired t-test p-values ranged from 0.003 to 0.015, and the Wilcoxon signed-rank test p-values ranged from 0.005 to 0.017. All values were well below the 0.05 threshold. These results indicate that the AGA model demonstrates a statistically significant advantage over the baseline in reducing prediction errors.
The assessment of convergence efficiency relies on two key metrics: the number of iterations required to reach convergence and the corresponding runtime. The experimental results are illustrated in Fig. 2.
The data presented in Fig. 2a indicate that the optimized AGA demonstrates a substantial reduction in the number of iterations needed for convergence. Specifically, the algorithm reaches optimal solutions within 20 iterations for strength training, 22 iterations for aerobic training, and 24 iterations for endurance training. These figures reflect a notable improvement compared to benchmark models, highlighting enhanced convergence efficiency. Figure 2(b) shows that regarding runtime performance, the optimized algorithm exhibits superior execution speed, completing the optimization process in 8.43 s for strength training, 9.87 s for aerobic training, and 10.52 s for endurance training. This reduction in computational time is attributed to dynamic parameter adjustments, elite retention strategies, and parallel processing techniques integrated within the algorithm’s framework.
The evaluation of robustness focuses on two key metrics: result stability and fault tolerance, providing insights into the algorithm’s consistency under varying conditions and its ability to handle data disturbances. The experimental outcomes are depicted in Fig. 3.
The data in Fig. 3a reveal that the optimized AGA exhibits superior result stability, as evidenced by low standard deviations across different training types: 0.06 for strength training, 0.05 for aerobic training, and 0.04 for endurance training. These low variability levels indicate consistent performance across multiple experimental runs. Figure 3(b) shows that the optimized model achieves high robustness scores: 0.82 for strength training, 0.85 for aerobic training, and 0.88 for endurance training. These results highlight the model’s capacity to maintain performance in the presence of incomplete or noisy data. For comparison, the EANN registers a lower fault tolerance score of 0.68 for strength training, underscoring the advantage of the optimized model in managing data perturbations effectively.
The evaluation of generalization ability employs two primary metrics: the R² coefficient and prediction accuracy, both of which measure the model’s capacity to generalize to unseen data. The experimental results are illustrated in Fig. 4.
As shown in Fig. 4a, the optimized model demonstrates strong generalization capabilities, achieving R² coefficients of 0.94 for strength training, 0.96 for aerobic training, and 0.97 for endurance training. These high R² values reflect the model’s effectiveness in explaining the variance within the data, indicating strong predictive relationships. Figure 4(b) shows that the optimized model achieves impressive scores of 0.91 for strength training, 0.94 for aerobic training, and 0.96 for endurance training. These results significantly surpass those of the comparative models, highlighting the optimized algorithm’s robustness in maintaining high predictive performance across diverse data environments.
Visualization analysis of load variation trends
The visualization analysis of dynamic load variation trends focuses on identifying temporal patterns across six distinct load types: strength load, aerobic load, endurance load, speed load, agility load, and flexibility load. Strength load primarily reflects explosive force generated by the lower limbs and trunk over short periods. It corresponds to peak forces during fencing lunges, rapid downward presses, and directional changes, and can be represented by acceleration peaks and the frequency of high-threshold segments. Aerobic load characterizes moderate-intensity, rhythmic, sustained activity. It corresponds to longer periods of reciprocal footwork and low-intensity combat in fencing and can be reflected by moderate acceleration variations over extended durations and the proportion of effective activity time. Endurance load emphasizes the cumulative effect of load over time. It corresponds to repeated circuit training and prolonged bouts of combat, indicating an athlete’s ability to maintain performance until the end. Indicators such as continuous activity duration, effective step counts, and load fluctuation amplitude are used for representation. Speed load focuses on step frequency and speed changes per unit time. It corresponds to rapid advances and retreats, sudden stops, and pursuit actions in fencing. Step rhythm intensity can be characterized by displacement estimates between adjacent time windows, rhythm variations, and high-frequency zero-crossing features. Agility load emphasizes the frequency of directional changes and acceleration shifts. It corresponds to distance adjustment, line changes, and evasive movements in fencing and can be measured by the number of lateral and longitudinal acceleration transitions, high-jerk events, and occurrences of irregular rhythm segments. Flexibility load reflects variations in body posture and movement amplitude. It corresponds to the range of motion in the hips, knees, ankles, and trunk during lunges, recoveries, and evasive actions, and is currently evaluated indirectly through posture transition frequency and segments with large posture changes.
This analysis reveals fluctuations in training demands, offering data-driven insights for optimizing training program designs. The experimental data are derived from time series measurements collected through sensor-based monitoring. The dataset spans a total training duration of 300 s, with sampling conducted at 5-second intervals. To facilitate detailed observation, the training timeline is segmented into six stages, labeled A through F, each covering 50 s. The temporal evolution of each load type is depicted in Fig. 5.
The analysis in Fig. 5 illustrates distinct trends for each load type:
The strength load exhibits a rapid ascent to an early peak of approximately 60, followed by a phase of fluctuating decline and eventual stabilization around an average load of 55, with a fluctuation amplitude of about 15. This trend indicates a high suitability for short-duration, high-intensity training, commonly associated with explosive power development. The initial peak reflects maximal muscle recruitment capacity, while the subsequent oscillations likely represent the physiological responses to muscle fatigue and recovery cycles during strength exertion. The aerobic load maintains a relatively stable trajectory, with an average load of around 45 and a minor fluctuation amplitude of approximately 8. A standard deviation of 3.5 underscores the consistency of this load, reflecting its alignment with sustained, moderate-intensity cardiovascular exercises. This load profile is characteristic of endurance activities such as continuous running and swimming, where minimal variation promotes efficiency over extended durations. The endurance load displays a gradual upward trend, peaking near 57 and maintaining this level over an extended duration of approximately 120 s. This prolonged peak reflects high-intensity demands sustained throughout the later stages of activity, emphasizing the importance of endurance capacity for prolonged performance. Such a trend is particularly relevant to marathon training and other endurance-focused sports that require consistent load maintenance over time. The speed load is characterized by periodic oscillations with an amplitude of around 10 and an average load of 40. These rapid fluctuations suggest applicability in short, high-intensity training sessions, such as sprint drills. The high-frequency variations indicate the emphasis on neuromuscular responsiveness, which is critical for developing explosive speed and quick reaction times. The agility load demonstrates the highest frequency of fluctuations, with an amplitude of approximately 9. The rapid alternating increases and decreases reflect the dynamic demands of agility-based exercises, designed to enhance coordination, balance, and reaction speed. This pattern aligns with sports requiring quick directional changes, such as fencing, basketball, and badminton. The flexibility load presents the most stable trend, marked by a low fluctuation amplitude of around 5 and an average load of 42. This stability suggests a consistent, low-intensity training profile, commonly associated with recovery-focused activities such as stretching routines or yoga. The minimal variability aligns with the supportive role of flexibility training in enhancing mobility and preventing injuries during more intensive training phases.
For a comparative overview, the load variation trends across all six load types are superimposed in Fig. 6.
The superimposed analysis in Fig. 6 highlights the distinctive characteristics of each load type. The endurance load stands out with the highest intensity and prolonged duration, while the strength load displays rapid peaks with significant fluctuations. Conversely, the flexibility load maintains the most consistent pattern, reflecting its auxiliary role in training regimens. The pronounced periodicity of the agility and speed loads suggests suitability for high-frequency, short-duration exercises, whereas the stable trend of the aerobic load supports its effectiveness in continuous, long-duration activities. Additionally, the comparative analysis of load characteristics across training types provides a scientific basis for structuring both individualized and group-based training plans. For instance, integrating strength and agility loads as primary components, complemented by endurance load for sustained conditioning, can enhance overall training efficiency in athletic development programs. This strategic load combination ensures a balanced approach, targeting multiple performance dimensions while optimizing recovery and adaptation processes.
Discussion
The experimental results from the performance comparison show that the optimized model outperformed all evaluated metrics. In terms of predictive performance, this model achieved low error rates and high fitting accuracy, demonstrating its ability to capture complex load patterns. The model also showed improved convergence efficiency, indicating that the optimization strategy effectively reduced computational resource requirements. Additionally, the model maintained stability and fault tolerance under varying conditions, supporting its reliability. Some comparative models performed well on specific metrics; however, their overall performance, particularly in generalization and robustness, was lower. This difference is likely due to limitations in handling complex nonlinear features and the lack of dynamic adjustment mechanisms, which are important for modeling diverse training load scenarios. Overall, the optimized model provides an efficient and stable approach for predicting fencing training loads. Its potential for practical applications, such as performance monitoring and training optimization, warrants further investigation.
The visualization of load variation trends provides an intuitive display of the dynamic characteristics of six distinct load types throughout the training process. Strength load and agility load exhibit patterns suitable for short-duration, high-intensity sessions, positioning them as core components within intermittent training frameworks. In contrast, aerobic load and endurance load demonstrate characteristics that align with medium-to-long-duration sustained training, contributing effectively to the enhancement of overall endurance and cardiovascular function. Speed load and flexibility load, with their distinctive fluctuation patterns, are particularly effective in auxiliary training, supporting specialized skill development and post-training recovery processes. The experimental findings highlight significant variations in load fluctuation patterns across different training types. This variability supports the flexible design of training programs tailored to specific performance objectives. Moreover, the integration of real-time monitoring and load adjustment through visualization techniques enhances both training efficiency and scientific validity. Future research could benefit from incorporating multidimensional datasets to improve the expressiveness of visualizations and deepen the analytical depth of load variation patterns, thereby advancing data-driven approaches in sports science and athletic training.
A potential concern is that the experimental validation in this study does not use data collected from fencers wearing sensors in real training environments. This limitation is fully acknowledged. However, the primary objective of the study is not to develop a final, athlete-specific model for predicting fencing training load. Instead, it aims to evaluate the feasibility, stability, and performance advantages of the proposed optimized adaptive genetic algorithm under complex, intermittent, and non-stationary load conditions. At this stage of methodological validation, the use of publicly available and well-structured datasets offers several benefits. These include improved reproducibility of results, greater control over experimental conditions, and enhanced transparency in algorithmic comparisons. The Daily and Sports Activities Dataset contains diverse movement patterns and short-term load fluctuations. Its temporal structure shares key similarities with fencing training, such as rapid changes in movement intensity and intermittent mechanical loading. As a result, the dataset is well suited for assessing the algorithm’s sensitivity to different load patterns and the robustness of its predictions. The study recognizes that incorporating sensor-based data collected from fencers during real training sessions in future work would further strengthen domain specificity and external validity. However, such data collection presents practical challenges, including standardizing sensor placement, ensuring consistency across training protocols, and obtaining ethical approval. Therefore, this study is positioned as a methodological foundation. Future research can build on this work by extending the proposed framework to more realistic fencing training scenarios using wearable sensor data.
Conclusion
This study develops an efficient fencing training load predictive model based on an optimized AGA integrated with data visualization analysis methods. Experimental evaluation and data analysis lead to the following conclusions:
- a.
The optimized AGA demonstrates clear advantages in predictive performance, convergence efficiency, and robustness. These improvements stem from enhancements to the fitness function, dynamic crossover and mutation strategies, and diversity regulation mechanisms. The experimental results show that the optimized model achieves lower prediction errors and higher computational efficiency than the comparison methods, indicating its suitability for fencing training load prediction across different scenarios.
- b.
Data visualization analysis reveals distinct variation patterns among different load types, including strength, aerobic, and endurance loads. The visualization results also illustrate the alignment between predicted values and observed data in an intuitive manner, providing effective decision-support tools for training monitoring and optimization.
- c.
The model performs well in handling complex nonlinear features and adapting to diverse training modalities, demonstrating stable generalization capability. These characteristics suggest potential applicability to training load management and optimization in other competitive sports beyond fencing.
Overall, this study provides technical support for fencing training load prediction and contributes methodological insights at the intersection of sports science and AI.
Despite these contributions, several limitations remain. First, the analysis primarily relies on univariate time-series data and does not fully account for individual athlete differences or external environmental factors. Second, although the visualization framework effectively captures dynamic load characteristics, further improvements are possible in terms of interactive and multidimensional data analysis. Future research will incorporate physiological indicators, such as oxygen consumption and blood lactate concentration, as well as environmental variables, including venue conditions and climate factors, to enhance predictive accuracy. In addition, the development of a real-time prediction and visualization feedback system based on Internet of Things technologies will be pursued to support dynamic load adjustment and scientific training management. Further studies will also examine the model’s applicability and stability in other sports, such as track and field and swimming, to evaluate its performance under diverse conditions. Addressing these limitations and extending the research scope will further strengthen the scientific rigor and practical value of the proposed framework, providing comprehensive methodological support for advances in sports science.
Data availability
All data generated or analysed during this study are included in this published article [and its supplementary information files].
References
-
Wenk, N. et al. Effect of immersive visualization technologies on cognitive load, motivation, usability, and embodiment. Virtual Real.27 (1), 307–331 (2023).
-
Aula, A. & Rashid, T. FOXTSA hybrid algorithm. Syst. Soft Comput.6, 200178 (2024).
-
Song, K., Scattone Silva, R., Hullfish, T. J., Silbernagel, K. G. & Baxter, J. R. Patellofemoral joint loading progression across 35 weightbearing rehabilitation exercises and activities of daily living. Am. J. Sports Med.51 (8), 2110–2119 (2023).
-
McIntosh, M. C. et al. Different resistance exercise loading paradigms similarly affect skeletal muscle gene expression patterns of myostatin-related targets and mTORC1 signaling markers. Cells12 (6), 898 (2023).
-
Arévalo-Mercado, C. A., Muñoz-Andrade, E. L., Cardona-Reyes, H. & Romero-Juárez, M. G. Applying cognitive load theory and the split attention effect to learning data structures. IEEE Revista Iberoamericana De Tecnologias Del. Aprendizaje. 18 (1), 107–113 (2023).
-
Aula, A. & Rashid, T. Foxtsage vs. Adam: comparative optimization analysis. Cogn. Syst. Res.92, 101373 (2025).
-
Ferlito, J. V. et al. Acute effect of low-load resistance exercise with blood flow restriction on oxidative stress biomarkers: A systematic review and meta-analysis. Plos One. 18 (4), 0283237 (2023).
-
Impellizzeri, F. M. et al. Understanding training load as exposure and dose. Sports Med.53 (9), 1667–1679 (2023).
-
Pedersen, A., Randers, M. B., Luteberget, L. S. & Møller, M. Validity of session rating of perceived exertion for measuring training load in youth team handball players. J. Strength. Conditioning Res.37 (1), 174–180 (2023).
-
Di-Martino, G. et al. Assessing the impact of fencing on postural parameters: observational study findings on elite athletes. Sports12 (5), 130 (2024).
-
Niță, V. A. & Magyar, P. Improving balance and movement control in fencing using Iot and real-time sensorial feedback. Sensors23 (24), 9801 (2023).
-
Yıldırım, E., Zengin, H. Y. & Cinemre, Ş. A. Training monitoring and effect of training variables on wellness score in elite male fencers. Turkish J. Sport Exerc.25 (1), 42–51 (2023).
-
Tona, E., Razali, R., Putra, S., Rizal, S. & Hasanuddin, I. Analysis of attack speed in fencing athletes. Path Sci.9 (9), 6001–6005 (2023).
-
Cao, Y. & Luan, J. A novel differential evolution algorithm with multi-population and elites regeneration. Plos One. 19 (4), e0302207 (2024).
-
Wang, P., Wu, X. & Deng, H. Large-scale multi-objective optimization algorithms: a decade survey. Expert Syst.42 (12), e70157 (2025).
-
Cao, Y., Dhekne, A., Ammar, M. & Visig Automatic interpretation of visual body signals using on-body sensors. Proceedings of the ACM on Interactive, Mobile, Wearable and Ubiquitous Technologies, ; 7(1): 1–27. (2023).
-
Piatysotska, S. et al. Study of short-term visual memory of athletes in Cyclic sports, martial arts and esports. Pedagogy Phys. Cult. Sports. 27 (6), 503–514 (2023).
-
Franzò, M., Pica, A., Pascucci, S., Marinozzi, F. & Bini, F. Hybrid system mixed reality and marker-less motion tracking for sports rehabilitation of martial arts athletes. Appl. Sci.13 (4), 2587 (2023).
-
AlShami, A., Boult, T. & Kalita, J. Pose2Trajectory: using Transformers on body pose to predict tennis player’s trajectory. J. Vis. Commun. Image Represent.97 (22), 103954 (2023).
-
Li, M. et al. Research on nonlinear tracking and evaluation of sports 3D vision action. Nonlinear Eng.12 (1), 20220243 (2023).
-
Müller, S. et al. Attributes of expert anticipation should inform the design of virtual reality simulators to accelerate learning and transfer of skill. Sports Med.53 (2), 301–309 (2023).
-
Aula, A. & Rashid, T. F. O. X. T. S. A. Navigating complex search spaces. Ain Shams Eng. J.16 (1), 103185 (2025).
-
Halbhuber, D. et al. Understanding the effects of perceived avatar appearance on latency sensitivity in full-body motion-tracked virtual reality. Proceedings of Mensch und Computer. ; 2023(1): 1–15. (2023).
-
Nguyen, T. N., Seifert, L., Hacques, G., Hammami Kölbl, M. & Chahir, Y. Vision-based global localization of points of gaze in sport climbing. Int. J. Pattern recognit. Artif. Intell.37 (7), 2355005 (2023).
Authors and Affiliations
Contributions
This study was independently conducted by Ya-nan Jia, who was responsible for the overall conceptualization and design of the research, data preprocessing, model development, experimental analysis, results visualization, literature review, and the complete writing and revision of the manuscript. The author has read and approved the final version of the manuscript and takes full responsibility for all aspects of the study.
Ethics declarations
Competing interests
The authors declare no competing interests.
Ethics approval and informed consent
This study was entirely based on publicly available, anonymized secondary datasets. No new participants were recruited, nor was there any direct contact or intervention with human subjects. Therefore, in accordance with institutional and journal ethical guidelines, no additional ethics committee approval or new informed consent was required for the secondary analysis of publicly anonymized data. The original data collection was conducted by the data providers with the necessary ethical approval and informed consent from the participants.
Additional information
Publisher’s note
Springer Nature remains neutral with regard to jurisdictional claims in published maps and institutional affiliations.
Supplementary Information
Below is the link to the electronic supplementary material.
Rights and permissions
Open Access This article is licensed under a Creative Commons Attribution-NonCommercial-NoDerivatives 4.0 International License, which permits any non-commercial use, sharing, distribution and reproduction in any medium or format, as long as you give appropriate credit to the original author(s) and the source, provide a link to the Creative Commons licence, and indicate if you modified the licensed material. You do not have permission under this licence to share adapted material derived from this article or parts of it. The images or other third party material in this article are included in the article’s Creative Commons licence, unless indicated otherwise in a credit line to the material. If material is not included in the article’s Creative Commons licence and your intended use is not permitted by statutory regulation or exceeds the permitted use, you will need to obtain permission directly from the copyright holder. To view a copy of this licence, visit http://creativecommons.org/licenses/by-nc-nd/4.0/.
About this article
Cite this article
Jia, Yn. Application and optimization of adaptive genetic algorithm in fencing training load prediction: a data visualization-based analytical approach.
Sci Rep16, 4582 (2026). https://doi.org/10.1038/s41598-025-34573-4
-
Version of record:03 February 2026
-
DOI
:https://doi.org/10.1038/s41598-025-34573-4
