

Abstract
Spatially resolved multimodal data enable the exploration of transcriptional, proteomic and metabolic regulation, yet analytical tools to integrate these spatial omics modalities, particularly spatial metabolomics, remain limited. We developed SpaMTP, an end-to-end framework that implements functions within a common Seurat architecture. It introduces analyses for metabolite annotation, joint clustering, enrichment tests, spatial alignment, multimodal integration, visualization and seamless software interoperability. Its utility is demonstrated across different biological systems.
Subjects
- Data integration
- Genetics research
Spatial metabolomics (SM) has rapidly advanced alongside spatial multiomics technologies, providing insights into metabolic activity within spatial contexts1. Common mass spectrometry (MS) imaging (MSI) platforms include secondary ion MS, matrix-assisted laser desorption ionization (MALDI) and desorption electrospray ionization, each offering different advantages in spatial resolution, throughput and tissue preservation2. However, adoption of SM lags behind spatial transcriptomics (ST), largely because of limited software capable of analyzing large SM datasets and/or integrating them with other spatial multiomics modalities1.
Only a small number of tools exist for MSI data processing and visualization3. Commercial software offers specialized functionality but requires costly licenses and lacks integration capabilities (Table 1). Open-source tools are more accessible, yet few are designed specifically for SM4, providing only limited analysis types. A major unmet need is metabolite annotation, as thousands of mass-to-charge (m/z) features are typically detected and multiple metabolite names may be assigned to one m/z value, complicating interpretation5,6. When databases and tools support annotation, they have limited downstream functionality and are not compatible with diverse datatypes. Importantly, integrating SM with other spatial omics modalities can enhance interpretability and enable multilayer investigation for deeper and cross-validated insights into complex biological processes, such as metabolic regulation7, yet no existing tool currently supports such integration (Table 1).
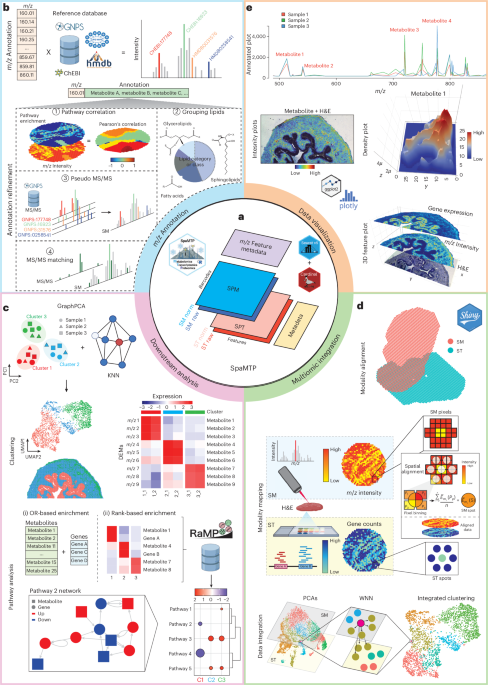
We introduce SpaMTP, a comprehensive tool for integrative SM and ST analysis (Fig. 1a) to address the gaps in platform-agnostic m/z annotation (Fig. 1b), cross-omics integration (Fig. 1c), downstream differential analyses (Fig. 1c) and joint pathway identification and visualization (Fig. 1d,e). SpaMTP was purposely built on the Seurat framework to facilitate broad applications by the single-cell and spatial research communities.
Results
SpaMTP comprehensive metabolite annotation functionalities
To assess the utility of SpaMTP, we analyzed multiple biological systems, including human lung8, murine urinary bladder9, murine brain7 and human glioma10, where the two latter contained paired ST–SM data at spot and single-cell resolution. Using the human lung dataset, we first compared SpaMTP’s metabolite annotation protocol to previously published METASPACE results (Fig. 2a and Methods). With a ±3-ppm threshold, SpaMTP annotated 80,235 and 39,215 m/z values from HMDB and LipidMaps, respectively, exceeding METASPACE (247 and 322 annotations at 20% false discovery rate). Among overlapping annotations, ~90% (HMDB: 87%, LipidMaps: 93%) matched, with many mismatches attributable to synonyms (Supplementary Table 1). Analyzing a spiked-in dataset, SpaMTP showed more accurate annotation than METASPACE (Extended Data Fig. 1). This highlights SpaMTP’s accuracy and usability while offering convenient offline implementation. Of note, SpaMTP implements four additional strategies to fine-tune annotation (Methods).
SpaMTP downstream analyses
To further demonstrate SpaMTP’s SM analysis capabilities, we next analyzed a mouse urinary bladder dataset9 (Fig. 2b). SpaMTP-assigned annotations for m/z values correctly matched those MS/MS-validated annotations in the original publication (Supplementary Table 2). Assessing the interoperability of SpaMTP, we converted the SpaMTP object to a Cardinal class to run Cardinal metabolite-only clustering. The resulting clusters aligned to defined tissue regions, including the urinary bladder muscle (cluster 2), adventitial layer (cluster 5) and urothelium (cluster 6) (Fig. 2b). Furthermore, SpaMTP identified 70 differentially expressed m/z peaks across the three tissue-specific clusters (Supplementary Table 3). Comparing the urothelium (cluster 6) and muscle layers (cluster 5), two metabolites, PC(34:1) and SM(34:1), appeared among the top upregulated, in line with previous results (Fig. 2c). Additionally, we found overexpression of a metabolite PC(30:2) within the urothelium, not found by other methods (Extended Data Fig. 2). Furthermore, using SpaMTP’s annotation grouping function, we found a large number of glycerolipids expressed within the urothelium, particularly PC and PE lipids (Fig. 2d,e and Methods), consistent with previous studies showing high levels of lipids within the human urothelium11.
Moreover, SpaMTP introduced an alternative clustering approach, which identified additional populations of cells, undetectable using Cardinal’s segmentation method, subdividing the urothelium region was divided into intermediate (cluster 2) and basal (cluster 3) epithelial cells (Fig. 2f). Additionally, cluster 5 spatially matched the location of the lamina propria undetected by Cardinal4. SpaMTP’s colocalization analysis found m/z 743.546 as the top mass value with spatial location correlating to cluster 5 (Fig. 2f). This peak was SM(18:16), consistent with a previous report on increased SM in lamina propria12. SpaMTP pathway analysis focusing on the urothelium (cluster 2 and cluster 3) revealed Gα-associated signaling pathways as highly upregulated (Fig. 2g). Previous studies showed that bladder urothelial cells express multiple G-protein-coupled receptors, implicating them in homeostasis, injury responses and potential therapeutic targeting13. Within the basal cell layer (cluster 3), sensory perception pathways were upregulated, likely because of the sensory neurons located in the basal layer of the bladder. Collectively, SpaMTP downstream SM-based analyses can provide users with the ability to deeply discover tissue biology and certain disease states, in a sensitive, robust and biologically meaningful manner, an important feature lacking in other SM packages (Table 1). Overall, compared to existing tools, SpaMTP provides the most comprehensive set of functionalities, encompassing four main analysis groups and eight subgroups, with over 30 analysis tasks, notably more than the 3–9 tasks covered by other tools (Table 1).
SpaMTP multimodal analyses
To evaluate SpaMTP’s multimodal functionality, we used a dataset from a mouse brain with a hemisphere showing Parkinson phenotype because of neurotoxin treatment7 (Fig. 2h,i). For this complex dataset, SpaMTP’s annotation demonstrated compatible processing of multiple MALDI matrices (Methods). SpaMTP’s data object contains multimodal data slots, such as SM, ST and spatial proteomics, projected to a common coordinate or a shared latent space for joint analysis (Fig. 1a). Here, different resolutions between SM and ST data were harmonized and mapped into each Visium spot. Using ST data alone, clustering could only identify the striatum tissue region (Extended Data Fig. 3). Alternatively, SM data alone were able to correctly distinguish between lesioned states but struggled to identify other common tissue structures revealed with ST data (Extended Data Fig. 3 and Methods). Multimodal clustering revealed a key population (cluster 2) localized within the intact striatum, strongly matching the spatial expression pattern of dopamine (Fig. 2i and Methods). SpaMTP’s pseudobulking DE analysis of the integrated clusters revealed dopamine upregulated in cluster 2 (Fig. 2j). Differential expression analysis revealed genes and pathways not found by unimodal analysis (Fig. 2k–n and Extended Data Fig. 4). The integration of DE metabolites and genes using SpaMTP revealed the elevated activity of the dopamine β-hydroxylase deficiency pathway (Fig. 2l). SpaMTP’s joint network analysis showed S-adenosyl-l-methionine (SAM), one of the pertinent metabolites linked to dopamine metabolism14, as strongly upregulated in the lesioned hemisphere (Fig. 2m,n). Through the enzyme catechol-O-methyltransferase, SAM functions as a methyl donor in the breakdown of neurotransmitters, including dopamine. A lack of dopamine substrates because of impaired uptake in the lesion and rapid dopamine degradation may explain the elevated SAM. SpaMTP’s network analysis results also revealed a chrome indole metabolite, D-dopachrome, which is potentially formed by oxidation of dopamine when exposed to oxidative stress, known to be associated with neurological disorders.
SpaMTP multiresolution analyses
SpaMTP allows the analysis of single-cell resolution data, as exemplified by the analysis of IDH-mutant glioma, where serial sections were profiled using 10X Xenium, MALDI time-of-flight (TOF) and post-Xenium immunofluorescence staining (Extended Data Figs. 4e,f and 5 and Methods). With precise spatial alignment (Extended Data Fig. 6), the integrated analysis identified tumor signatures, characterized by high expression of VIM and increased spermidine abundance (Extended Data Fig. 5). Glioma cells upregulate polyamine biosynthesis through ornithine decarboxylase, leading to elevated spermidine levels15. Moreover, SpaMTP integrated pathway analysis revealed tumor-specific enrichment of glucose metabolism pathways, consistent with the metabolic reprogramming characteristic of IDH-mutant gliomas (Extended Data Figs. 4 and 5). This observation demonstrates the power of simultaneous integration over unimodal analysis alone (Methods).
Discussion
SpaMTP represents an open-source package with an end-to-end analytic pipeline for integrating and analyzing paired SM and ST data. Its user-friendly interface and Seurat-based data structure make SpaMTP highly accessible and interoperable across spatial and single-cell analysis workflows. Future directions include extending support for cohort-level analysis, building three-dimensional (3D) models across serial sections and integrating additional modalities such as spatial epigenomics to further enhance multiomic insight. SpaMTP has improved metabolite annotation but is still limited by the inherent uncertainty in metabolite structure and incomplete reference databases.
Methods
SpaMTP is designed to facilitate a data analysis framework for matched SM and ST data (Fig. 1a). At the core of the package is a standardized data structure that builds on the widely used single-cell analysis Seurat class object16, ensuring efficiency of data operations. Additionally, the data structure provides the ability to retain informative metadata for both spatial locations and features (Fig. 1a). To facilitate flexible environments, data can be loaded in various formats including imaging MS markup language (imzML) files using LoadSM, which expands on Cardinal’s implementation, or as a preprocessed matrix using ReadSM_mtx, enabling preprocessing through other pipelines. SpaMTP also implements various data normalization methods such as library size log normalization and total ion current (TIC) normalization (NormaliseSMData). Quality control of preprocessed data can also be visualized using a range of SpaMTP plotting functions.
While capable of analyzing solely SM data, a unique feature of SpaMTP is the support of integrated multiomics analysis. For optimal multimodal integration, paired SM and ST data from an identical tissue section is preferred; however, SpaMTP can also be used in conjunction with other packages to successfully align paired data from serial sections. SpaMTP inherits functionality from Cardinal and Seurat, whilst also implementing numerous new downstream analysis methods (Table 1).
m/z annotation
The main annotation function of SpaMTP, (AnnotateSM), is able to assign putative metabolite annotations to every valid m/z value, applicable for any data type generated, including TOF data (Fig. 1b). Briefly, public metabolite databases (ChEBI, HMDB, GNPS and LIPIDMAPs) were downloaded, cleaned and standardized using the CompoundDB R package17, including the calculation of 47 common adducts for each neutral mass (Fig. 1b). This reference database can be filtered on the basis of user-defined parameters (for example, polarity, adducts and elemental composition) and exact mass matching for each valid m/z value within a user-specified ppm error range can be performed. Note that all possible isomers are reported for each match, consistent with a Metabolomics Standards Initiative level 4 identification18.
Often, a single m/z peak may be assigned to hundreds of potential metabolites or isomers, making interpretation challenging. Therefore, SpaMTP offers four complementary strategies to reduce the number of annotations per m/z value (each with user-defined parameters to control filtering):
-
CalculateAnnotationStatistics: This function improves metabolite annotation by incorporating pathway-level correlations derived from spatially resolved omics data (Extended Data Fig. 7). Briefly, for a given m/z, matching intensity values are assigned to each possible metabolite annotation. Depending on the available data (that is, metabolite-only or integrated multiomic data), a normalized and scaled pathway enrichment matrix is generated on the basis of the mean abundance values of all matching analytes corresponding to a given pathway. Then, for each annotated metabolite, Pearson correlation values are calculated for each associated pathway on the basis of its colocalization with the queried m/z intensity. The highest correlation and number of significant pathways per annotated metabolite are then used to calculate a heuristic P value and adjusted P value to rank the most likely metabolite for each m/z mass. Therefore, metabolite annotations that show strong correlations and are associated with numerous pathways are prioritized, providing biologically contextual support for annotation and reducing false positives.
-
RefineLipids: This function addresses the ambiguity of lipid identification, where a single m/z value can correspond to thousands of possible metabolites because of lipid structural complexity and MS limitations19. Building on rgoslin, m/z values are classified and summarized into major classes using standard lipid nomenclature (Fig. 1b). Annotated lipids are grouped into general categories (for example, glycerolipids and sphingolipids), subclasses (for example, diacylglycerols, triacylglycerols and phosphatidic acid) and refined species19. This also enables intensity binning of similar lipid types, supporting the evaluation of their collective biological roles rather than as individual features (Fig. 1b).
-
Pseudo_msms: Based on ms1-id20, we implement an annotation strategy that combines correlation-based feature clustering with reverse spectral matching to use in-ts are formed during the ionization process, before the molecule enters the collision cell
-
Compare_msms: When retention time data are available (for example, from liquid chromatography–MS or MS/MS), this function can serve as an orthogonal validation method to assess the accuracy of metabolite annotations, thereby increasing confidence in annotation results.
Matched annotation and additional parameters are individually stored in the SpaMTP m/z metadata slot (Fig. 1a), providing the ability to query, label, combine and plot metabolite expression directly by name.
In the analysis of mouse bladder urothelium region, many of the DE metabolites were lipids (Fig. 2d). Because of their molecular structure (long carbon chains), a key issue when handling lipids is the excessive numbers of possible annotated metabolites associated with one m/z mass (Supplementary Table 3). To simplify these annotations, we used SpaMTP’s lipid nomenclature functionality to refine the original annotation. These simplified annotations highlighted the large number of glycerolipids expressed within the urothelium, particularly PC and PE lipids (Fig. 2e), consistent with previous work11.
SpaMTP’s metabolite annotation performance
We compared the performance of SpaMTP and METASPACE using a publicly available benchmarking dataset containing seven spiked-in metabolites at defined spatial locations20. SpaMTP was the only method to correctly identify all metabolites, whereas METASPACE misannotated two peaks corresponding to glutathione (Extended Data Fig. 1). Further application of SpaMTP’s CalculateAnnotationStatistics function eliminated false positives entirely, achieving perfect recall (Extended Data Fig. 7).
Spatially and interpretably map pixels to a low dimensional space for clustering
Many spatial omics pipelines, including SpaMTP, facilitate the functional interpretation of regional characteristics using principal component analysis (PCA), uniform manifold approximation projection (UMAP) and t-distributed stochastic neighbor embedding. SpaMTP implements a standard PCA pipeline (RunMetabolicPCA) and spatial graph-based PCA (RunSpatialGraphPCA), along with providing users the ability to alter the dataset bin size to reduce noise from metabolic signal mapped to tissue. To interpret clustering of spatial tissue bins on the basis of metabolic signal, SpaMTP effectively implements established Seurat functions16. SpaMTP also incorporates spatially informed PCA analysis (RunSpatialGraphPCA) using methods established by the Python package GraphPCA21,22. In combination, these functions can be executed to identify spatial tissue regions with similar metabolic landscapes and biological signatures, inferred from metabolic data.
Pseudobulking metabolite signals for differential abundance analysis
One key analysis method for SM data is the ability to compare the abundance levels of metabolites across spatial regions. Using similar approaches to bulk and single-cell transcriptomics, here, we implement a function to perform random pooling and pseudobulking to uncover differentially expressed metabolites (FindAllDEMs)23. Briefly, pixels in spatial regions will be randomly divided into n number of pools, with default n = 3 suggested, and their relative intensity values for each m/z are summed (pseudobulking). Using EdgeR, pseudobulked intensity values for each metabolite are then compared for differential abundance24, supporting both simple and complex experimental designs. This pseudobulking analysis results in artificially deflated P values, yet this method is more robust and scalable method than testing using all pixels. In addition, for each m/z value, statistics are calculated, permitting the use of visualization methods.
Integrated pathway analysis of enriched metabolites and transcriptional information
SpaMTP incorporates three principal classes of enrichment analysis that can use metabolite abundance, gene expression or both modalities simultaneously: (1) overrepresentation-based pathway analysis (ORA) (FishersPathwayAnalysis); (2) rank-based enrichment analysis (FindRegionalPathways); and (3) feature set coregulation analysis (RunRAMPgeseca). These pathway approaches differ in their complexity, with ORA representing the simplest and fastest method based on Fishers’s exact test or chi-square test25. Rank-based enrichment analysis instead also accounts for the magnitude and direction of changes in analyte abundance, allowing users to identify pathways differentially expressed between groups of interest26. Lastly, feature set coregulation analysis identifies feature sets that display strong coregulation on the basis of variance across all samples or cells27. In addition, SpaMTP performs multimodal network-based enrichment analysis (PathwayNetworkPlots), implementing an enrichment map to integrate both metabolite and gene expression values to generate an interactive network visualization of analyte interactions28. To implement these analyses, SpaMTP leverages 53,952 pathway databases available through RaMP-DB29,30.
Multimodal pathway analysis benchmarking
We evaluated the performance of SpaMTP’s pathway enrichment analysis against existing tools for bulk data (MetaboAnalyst and Ingenuity Pathway Analysis (IPA))31,32. We used input data containing metabolites and genes from differential expression results comparing the intact and lesioned striatum (Supplementary Table 4). SpaMTP identified the highest number of significant pathways (164) compared to IPA (44) and MetaboAnalyst (0) (Extended Data Fig. 4a,b). Only SpaMTP uncovered pathways associated with dopamine metabolism. To assess whether multimodal analysis revealed information missed by single-modality approaches, we compared pathway outputs in two settings. In the Parkison mouse model, SM alone detected 50 pathways differentially expressed between intact and lesioned striatum and ST alone detected 332, whereas SpaMTP’s combined multimodal approach identified 892 (Extended Data Fig. 4a,b). A total of 539 pathways were exclusively detected with the multimodal approach, including biologically relevant pathways, such as dopaminergic synapse and dopamine neurotransmitter release cycle. Similarly, in the IDH-mutant glioma sample, 173 pathways were identified from SM alone to be differentially expressed between tumor and adjacent normal, 11 were identified from ST alone and 181 were identified through integration (Extended Data Fig. 4a,b). Of these, 22 were unique to the combined approach, including fumarate metabolism, consistent with known IDH-driven metabolic rewiring (Extended Data Fig. 4a,b). These findings highlight SpaMTP’s ability to extract biologically meaningful, spatially contextualized pathways by leveraging multimodal data integration.
Multimodal alignment
This package is optimally designed to combine SM data with spatial data from other omics technologies, such as ST data. While prealigned data can be loaded directly, SpaMTP also provides two functions that allow for the manual alignment (AlignSpatialOmics) and mapping (MapSpatialOmics) of spatial multiomics data to the same common coordinate system (Fig. 1d).
Briefly, AlignSpatialOmics provides an interactive platform for aligning spatial coordinates between modalities to a common system (Extended Data Fig. 8). Following this, the MapSpatialOmics function processes both modalities by first generating polygon objects for each SM pixel and ST spot. This is achieved by expanding the centroided pixel coordinate values by the median distance between neighboring pixels or by a prespecified size. According to the radius of each ST spot, all polygons that overlap are assigned to their respective spot. In cases where multiple pixels are assigned to a single spot or cell, the mean intensity value for each m/z mass is allocated. Using Seurat’s assay class design, the common spatial coordinate system is matched to a transcriptomics (‘SPT’) and metabolic (‘SPM’) assay, containing raw gene count and metabolite intensity values respectively (Fig. 1a). This results in a single SpaMTP object storing data values from both modalities. This principle can be flexibly applied for integrating any further spatial modality (that is, spatial proteomics data).
SpaMTP provides various functions for analyzing multimodal data including spatial correlation analysis of both genes and metabolites simultaneously. Additionally, cross-modality integration can be performed to generate informative clusters on the basis of similar transcriptional and metabolic patterns (Fig. 1d). Data integration is executed using weighted nearest neighbors (WNN) implemented by Seurat16 using embedding generated by SpaMTP’s GraphPCA, which helps to preserve both global and local relationships in the data. WNN allows the user to adjust modality weighting (default weighting of 0.5 for SM and ST) according to biological rationale (Extended Data Fig. 9). This data integration can improve the clustering performance by more accurately detecting biologically meaningful cell clusters.
Visualization of spatial metabolic and multimodal data
SpaMTP provides a wide range of visualization methods and interactive tools to intuitively display different biological results (Fig. 1e). To visualize pathway analysis results, SpaMTP provides a ggplot2-based dot plot to assess enrichment elements, P values and Jaccard distances between enriched pathways (PlotRegionalPathways) and the VisualisePathways function generates an expression plot alongside each pathway (Figs. 1c and 2k–m). These visualizations are further enhanced by quantitative colocalization metrics such as Moran’s I (FindSpatiallyVariableMetabolites) and Pearson correlation (FindCorrelatedFeatures), which support spatial interpretation of multimodal molecular patterns.
For visualizing the expression levels of individual mass-to-charge peaks, SpaMTP offers tools for summarizing mass intensity and spatial intensity plots interactively. This functionality is provided with two interactive tools, Plot3DFeatures and DensityPlot, which provide a 3D visualization (Fig. 1e), either displaying multilayered metabolite or gene expression or the density of a metabolite intensity across spatial coordinates. For this, in SpaMTP, we implement a Gaussian kernel density estimation through Javascript’s library with an unbiased cross-validation for bandwidth parameters. These functions can help enhance the interpretability of spatially significant peaks and multimodality-based correlations.
Runtime and memory usage
We performed benchmarking of SpaMTP’s main functions to assess runtime and memory usage (Extended Data Fig. 10). Metabolite annotation and multiomics integration in SpaMTP scaled efficiently with dataset size (up tp 5,000 metabolites, 150,000 spatial bins). GraphPCA required more computational resources. To further reduce memory load and computational resources, methods such as Sketch-based PCA can be applied in SpaMTP (Extended Data Fig. 10).
Downstream analysis of the murine urinary bladder dataset
To demonstrate the capabilities of a SpaMTP-based SM analytic pipeline, we first analyzed a commonly used metabolomics benchmarking dataset, the mouse urinary bladder dataset21 (Fig. 2b). We first performed spatially aware shrunken centroid (ssc) clustering (Fig. 2b). This generated segments that aligned to defined tissue regions including the urinary bladder muscle (cluster 2), adventitial layer (cluster 5) and urothelium (cluster 6). Next, we performed differential abundance analysis for metabolites across each of these three clusters. We found 70 differential abundant metabolites, some of which have been reported as biologically important (for example, PC(34:1), SM(34:1) and PC(30:2)). As many of the differentially expressed metabolites were lipids, we used SpaMTP’s lipid nomenclature grouping functionality to refine the original annotation (Table 1). The grouping functionality determined categories and classes of lipids that were differentially expressed within the urothelium, particularly PC and PE lipids (Fig. 2e), consistent with previous publications identifying high levels of lipids present within the urothelium of humans11.
As an alternative to common ssc clustering, SpaMTP provides an interpretable metabolite-based PCA analysis tool that works in conjunction with Seurat’s in-built graph-based clustering methods (for example, FindClusters). SpaMTP clustering identified a new cluster, corresponding to the lamina propria. SpaMTP’s colocalization analysis between metabolite distribution and spatial cluster labels identified metabolite markers for the new cluster (Fig. 2f). To further interrogate these results, we performed pathway analysis. SpaMTP pathway analysis revealed Gα-associated signaling pathways and sensory perception pathways. Outside of the urothelium, regions such as the adventitia (cluster 4) and lamina propria displayed increased sphingolipid metabolism12. The identification of these region-specific pathways demonstrates the ability of SpaMTP to identify deeper biological processes, which are lacking in most other SM packages (Table 1).
Integration and analysis of multiomics Parkinson mouse dataset
We used a public Parkinson mouse brain dataset containing paired MALDI-TOF and 10X Visium data generated from the same tissue section. Here, we also individually analyzed two different MALDI matrices each with paired Visium data (FMP-10 and DHB matrices)29. SpaMTP can handle and annotate any MALDI matrix. This includes FMP-10 data, whereby predefined metabolite annotations were assigned to corresponding m/z values using SpaMTP’s AddCustomAnnotation function. Using SpaMTP, all modalities were aligned. The spatial distribution patterns of each metabolite were unaffected by the alignment process, demonstrated by the comparison between spot-binned and original raw pixel expression values for dopamine (Fig. 2h). Both modalities were integrated with SpaMTP through an optimized Seurat-based WNN function (MultiOmicIntegration) using equal modality weightings (metabolite/gene = 0.5/0.5). The resulting integrated clusters were further characterized using SpaMTP’s pseudobulking differential expression analysis. The integrated clusters revealed that both FMP-10-derivatized dopamine molecules (single and double derivatized) were upregulated in cluster 2 compared to all other clusters (Fig. 2j). In addition, differential gene expression analysis across all integrated clusters revealed multiple genes, including Pcp4, associated with the metabolic state of the intact striatum. These genes were unidentifiable when analyzing purely ST-based clustering results. Pairs of metabolites and genes, such as dopamine and Pcp4, can be visualized in a 3D plot to clearly observe region-specific correlations between modalities (Fig. 2k).
To assess the multimodal clustering, we calculated various metrics associated with dopamine abundance within the cluster corresponding to the intact striatum and compared clustering methods, with or without integration (Extended Data Fig. 3). Across almost all metrics, SpaMTP integrated clustering outperformed all other clustering methods. These results collectively highlight the benefit of integrating data from different modalities.
Biological pathways involve interactions between molecular compounds across different biological modalities. In analyzing the effects of striatal lesions in the mouse brain, the integration of differentially expressed metabolites and genes using SpaMTP revealed significant alterations in several neurological pathways (Fig. 2l). SpaMTP’s joint analyses identified the dopamine β-hydroxylase deficiency pathway in the context of oxidative stress, highlighting the roles of SAM and D-dopachrome. SpaMTP’s network visualization tool (PathwayNetworkPlots) displays altered expression of individual genes and analytes within this pathway and metabolites with a key role in this understudied mechanism of dopamine downregulation (Fig. 2m). The interplay of regulation mechanisms across different modalities highlights the potential explanation of dopamine dysregulation following striatal damage.
Single-cell resolution multiomics integration of glioma dataset
To demonstrate SpaMTP’s capabilities with single-cell resolution data, we applied it to an IDH-mutant glioma sample, where serial sections were profiled using 10X Xenium ST, MALDI-TOF SM and post-Xenium immunofluorescence staining (Extended Data Fig. 5). The spatial domain spanned from the tumor core to adjacent normal tissue, enabling the examination of tumor infiltration and the cellular leading edge. Cell-morphology-based segmentation of the 10X Xenium ST data was combined with precise spatial alignment to MALDI MSI. We showed that the fumarate metabolism pathway could only be identified by multimodal integration (Extended Data Fig. 4). Similarly, the integrated data had higher detection sensitivity for glycolysis and neuronal pathways than unimodal analysis.
Reporting summary
Further information on research design is available in the Nature Portfolio Reporting Summary linked to this article.
Data availability
All data analyzed in this publication were publicly available, including the human lung MSI and spotted mouse liver from METASPACE (https://metaspace2020.org/dataset/2020-12-01_22h59m24s and https://metaspace2020.org/dataset/2020-12-07_03h16m14s), the murine urinary bladder from the Proteomics Identifications Database (PXD001283) and the 10X Visium and MALDI (FMP-10 and DHB matrices) Parkinson mouse brain data (https://doi.org/10.17044/scilifelab.22770161.v2). The IDH-mutant tumor data are available from the BioImage Archive (https://doi.org/10.6019/S-BIAD14260). All data objects used for vignettes can also be found on the SpaMTP Zenodo community page (https://zenodo.org/communities/spamtp).
Databases used for metabolite annotation include HMDB (https://hmdb.ca/downloads; released November 2, 2021), ChEBI (https://ftp.ebi.ac.uk/pub/databases/chebi/SDF/; released September 1, 2023), LIPIDMAPS (https://www.lipidmaps.org/databases/lmsd/download; released September 15, 2023) and GNPS (https://gnps.ucsd.edu/; released April 21, 2025)
Code availability
References
-
Alexandrov, T. Spatial metabolomics: from a niche field towards a driver of innovation. Nat. Metab.5, 1443–1445 (2023).
-
Petras, D., Jarmusch, A. K. & Dorrestein, P. C. From single cells to our planet—recent advances in using mass spectrometry for spatially resolved metabolomics. Curr. Opin. Chem. Biol.36, 24–31 (2017).
-
Weiskirchen, R. et al. Software solutions for evaluation and visualization of laser ablation inductively coupled plasma mass spectrometry imaging (LA-ICP-MSI) data: a short overview. J. Cheminform.11, 16 (2019).
-
Bemis, K. A. et al. Cardinal v.3: a versatile open-s20, 1883–1886 (2023)
-
Alseekh, S. et al. Mass spectrometry-based metabolomics: a guide for annotation, quantification and best reporting practices. Nat. Methods18, 747–756 (2021).
-
Alexandrov, T. et al. METASPACE: a community-populated knowledge base of spatial metabolomes in health and disease. Preprint at bioRxivhttps://doi.org/10.1101/539478 (2019).
-
Vicari, M. et al. Spatial multimodal analysis of transcriptomes and metabolomes in tissues. Nat. Biotechnol.42, 1046–1050 (2024).
-
Lukowski, J. K. et al. An optimized approach and inflation media for obtaining complimentary mass spectrometry-based omics data from human lung tissue. Front. Mol. Biosci.9, 1022775 (2022).
-
Römpp, A. et al. Histology by mass spectrometry: label-free tissue characterization obtained from high-accuracy bioanalytical imaging. Angew. Chem. Int. Ed. Engl.49, 3834–3838 (2010).
-
Drummond, K. J. et al. Perioperative IDH inhibition in treatment-naive IDH-mutant glioma: a pilot trial. Nat. Med.31, 3451–3463 (2025).
-
Watanabe, T. et al. The urinary bladder is rich in glycosphingolipids composed of phytoceramides. J. Lipid Res.63, 100303 (2022).
-
Ueda, Y. et al. Sphingomyelin localization in the intestinal crypt surface. Biochem. Biophys. Res. Commun.611, 14–18 (2022).
-
Merrill, L. et al. Receptors, channels, and signalling in the urothelial sensory system in the bladder. Nat. Rev. Urol.13, 193–204 (2016).
-
Sharma, A. et al. S-adenosylmethionine (SAMe) for neuropsychiatric disorders: a clinician-oriented review of research. J. Clin. Psychiatry78, e656–e667 (2017).
-
Kay, K. E. et al. Tumor cell-derived spermidine promotes a protumorigenic immune microenvironment in glioblastoma
-
Stuart, T. et al. Comprehensive integration of single-cell data. Cell177, 1888–1902 (2019).
-
Rainer, J. et al. A modular and expandable ecosystem for metabolomics data annotation in R. Metabolites12, 173 (2022).
-
Sumner, L. W. et al. Proposed minimum reporting standards for chemical analysis Chemical Analysis Working Group (CAWG) Metabolomics Standards Initiative (MSI). Metabolomics3, 211–221 (2007).
-
Kopczynski, D. et al. Goslin: a grammar of succinct lipid nomenclature. Anal. Chem.92, 10957–10960 (2020).
-
Xing, S. et al. Structural annotation of full-scan MS data: a unified solution for LC–MS and MS imaging analyses. Preprint at bioRxivhttps://doi.org/10.1101/2024.10.14.618269 (2025).
-
Yang, J. et al. GraphPCA: a fast and interpretable dimension reduction algorithm for spatial transcriptomics data. Genome Biol.25, 287 (2024).
-
Ozier-Lafontaine, A. et al. Kernel-based testing for single-cell differential analysis. Genome Biol.25, 114 (2024).
-
Gagnon, J. et al. Recommendations of scRNA-seq differential gene expression analysis based on comprehensive benchmarking. Life12, 850 (2022).
-
Robinson, M. D., McCarthy, D. J. & Smyth, G. K. edgeR: a Bioconductor package for differential expression analysis of digital gene expression data. Bioinformatics26, 139–140 (2010).
-
García-Campos, M. A., Espinal-Enríquez, J. & Hernández-Lemus, E. Pathway analysis: state of the art. Front. Physiol.6, 383 (2015).
-
Subramanian, A. et al. Gene set enrichment analysis: a knowledge-based approach for interpreting genome-wide expression profiles. Proc. Natl Acad. Sci. USA102, 15545–15550 (2005).
-
Korotkevich, G. et al. Fast gene set enrichment analysis. Preprint at bioRxivhttps://doi.org/10.1101/060012 (2021).
-
Merico, D. et al. Enrichment map: a network-based method for gene-set enrichment visualization and interpretation. PLoS ONE5, E13984 (2010).
-
Braisted, J. et al. RaMP-DB 2.0: a renovated knowledgebase for deriving biological and chemical insight from metabolites, proteins, and genes. Bioinformatics39, btac726 (2023).
-
Sales, G., Calura, E. & Romualdi, C. metaGraphite—a new layer of pathway annotation to get metabolite networks. Bioinformatics35, 1258–1260 (2019).
-
Pang, Z. et al. MetaboAnalyst 6.0: towards a unified platform for metabolomics data processing, analysis and interpretation. Nucleic Acids Res.52, W398–W406 (2024).
-
Shao, Z. et al. Ingenuity pathway analysis of differentially expressed genes involved in signaling pathways and molecular networks in RhoE gene‑edited cardiomyocytes. Int. J. Mol. Med.46, 1225–1238 (2020).
Acknowledgements
This work was made possible and financially supported in part through our membership of the Brain Cancer Center and support from Carrie’s Beanies 4 Brain Cancer, Victorian State Government Operational Infrastructure and Australian Government National Health and Medical Research Council (NHMRC) Independent Research Institutes Infrastructure Support Scheme. The work was also supported by the Australian Cancer Research Foundation Center for Optimized Cancer Therapy and the Queensland Institute of Medical Research Berghofer Spatial Tissue and Artificial Intelligence Research Center (A.C., A.N., H.V., X.T. and Q.N.). Further support included funding from the Venture Grants Scheme administered by Cancer Council Victoria (VG2022 to S.A.B., S.F. and J.R.W.), support from the NHMRC (2033815 to J.R.W., 2001514 to Q.N.), an NHMRC Investigator Fellowship (2008928 to Q.N.), a Victorian Cancer Agency Mid-Career Research Fellowship (MCRF22003 to S.A.B.), a Walter and Eliza Hall Institute (WEHI) Page Betheras Award (S.A.B.), a WEHI Johnson PhD Scholarship (J.J.D.M.), an Australian Government Research Training Program Scholarship (J.J.D.M. and T.L.), CSL Translational Data Science Scholarship (J.J.D.M.) and University of Queensland PhD scholarships (X.T., T.V. and A.N.).
Authors and Affiliations
Contributions
Q.N., S.F., A.C. and T.L. conceptualized the project. A.C., T.L. and C.C.J.F. developed the methods and code for SpaMTP. A.C. led the software development. A.N., C.C., C.C.J.F., T.V., X.T. and V.K.N. contributed to analysis and software development. A.C., T.L. and H.V. tested all software. A.C. curated the three public datasets and generated the vignettes, figures, supplementary material and package website. T.L., J.K. and J.J.D.M. generated and processed the IDH-mutant glioma data. A.C. and T.L. wrote the paper, and J.R.W., S.A.B., S.F. and Q.N. provided feedback and revised the paper. Q.N. and S.F. provided project guidance and supervision. All authors read and approved the final paper.
Ethics declarations
Competing interests
The authors declare no competing interests.
Peer review
Peer review information
Nature Methods thanks Reza Salek and the other, anonymous, reviewer(s) for their contribution to the peer review of this work. Peer reviewer reports are available. Primary Handling Editor: Madhura Mukhopadhyay, in collaboration with the Nature Methods team.
Additional information
Publisher’s note Springer Nature remains neutral with regard to jurisdictional claims in published maps and institutional affiliations.
Extended data
Extended Data Fig. 1 Annotation benchmarking of SpaMTP using a mouse liver dataset with spotted chemical standards.
a. Spatial distribution of spotted chemical standards. b. Mass intensity plot highlighting the m/z peaks annotated by both METASPACE and SpaMTP (upper section) and m/z masses only annotated by SpaMTP (lower section) corresponding to the relative spotted chemicals. c. Spatial plots indicating the location of 4 different m/z peaks all annotated as Glutathione by SpaMTP, against their relative annotations by METASPACE. d. Bargraph demonstrating benchmarking metrics comparing accuracy, F1, FDR, precision and recall scores between METASPACE (at different FDR significance levels) and SpaMTP. This plot also includes benchmarking results using the CalculateAnnotationStatistics function to identify the most likely metabolite per m/z mass. e. Scores of most likely metabolite for m/z = 342.05386, 181.03854, 182.02256, 266.08948 corresponding to the spotted chemical standards.
Extended Data Fig. 2 Confirming phosphatidylcholine 30:2 expression in urothelium using numerous SpaMTP visualisation methods.
a. Summed expression of PC(30:2) per cluster against all present m/z values. The boxplot displays the median, 25th and 75th percentiles, with whiskers spanning from the 5th to the 95th percentiles. b. Spatial expression of PC(30:2) across the tissue section. c. Density kernel representing the gaussian distribution of PC(30:2) across the section.
Extended Data Fig. 3 Comparison of SpaMTP’s spatial clustering and multi-omics data integration.
a. Tissue region annotations provided by the original publication4. Spatial clustering results using SpaMTP implemented GraphPCA of: only spatial metabolomics (SM) data (b), only spatial transcriptomics (ST) data (c) and integrated SM and ST data using weighted nearest neighbours (d). e. Heatmap displaying metrics of dopamine expression across spots within the annotated intact Striatum region compared to key clusters identified using integrated data (cluster 2 and 10), SM data only (cluster 1 and 5) and ST data only (cluster 5, 7 and 9). f. Bargraph displaying scores of three metrics evaluating the biological relevance of each clustering result (integrated, SM only and ST only). These metrics include proportion of dopamine positive spots, Pearson correlation scores between key clusters and dopamine expression, and ARI clustering relative to the annotations.
Extended Data Fig. 4 SpaMTP pathway analysis benchmarking.
a. Upset plot displaying benchmarking results of multi-modal pathway analysis between SpaMTP, MetaboAnalyst and Ingenuity PathwayAnalysis (IPA) packages (for the mouse brain paired MALDI and 10X Visium dataset4). b. Heatmap of top 10 pathways identified by each package based on genes and metabolites differentially expressed within the intact striatum compared to the lesioned striatum. The Dopamine beta-hydroxylase deficiency pathway is highlighted. Hypergeometric test was used for pathway enrichment analysis. c. Comparison of number of significant pathways identified using SpaMTP’s implementation of gene set co-regulation analysis using only metabolomics, only transcriptomics and the combined multi-omics data. d. Spatial distribution and relative adjusted p-value of the ‘Parkinson disease’ pathway using metabolomic, transcriptomic and multi-omic data. e. Tissue image and annotation for the IDH-mutant glioma patient sample, with the single cell resolution sequential SM and ST data. f. Comparison of the unimodal and multi-modal pathway analysis on the glioma sample, showing shared and unique pathways for differentially expressed metabolites, genes and joint genes-metabolites pathways between the tumour and leading edge regions. g. Pathway activity visualisation for the top three most differentially expressed pathways, including Fumarate metabolism, Glycolysis and Neuronal Synapse. The p-values show significance from two-sided Wilcoxon tests between the tumour and leading edge regions, displaying more significant results derived from joint multiomics analysis.
Extended Data Fig. 5 Application of SpaMTP to a dataset of IDH-mutated glioma sample containing SM, ST and spatial proteomics.
a. Single cell resolution ST annotated by cell type. b. Spatial gene expression of VIM across the tissue section. c. Spatial abundance of GFAP quantified from immunofluorescence and normalized between 0 and 1. d. Density map of spatial abundance of spermidine (normalized between 0 and 1). e. Spatial multi-omics expression of Glucose pathway. f. Spatial multi-omics expression of Neuronal System pathway.
Extended Data Fig. 6 Large Deformation Diffeomorphic Metric Mapping (LDDMM) of spatial transcriptomic (ST) and spatial metabolomic (SM) data of an astrocytoma patient sample.
a. Original SM pixel array (source dataset). b. Cell centroids of serial ST section (target dataset). c. Overlay of non-transformed metabolomics pixel array and ST cell centroids showing spatial discrepancy. d. Metabolite pixel array aligned to cell centroids through LDDMM transformation. e. Alignment error between source (metabolomics pixel array) and target ST datasets indicating accurate alignment between datasets. f. Overlay of transformed metabolite pixel array and ST cell centroids indicating accurate alignment compared to the non-transformed datasets (top left). Scale, 1 mm.
Extended Data Fig. 7 Schematic of annotation ranking by pathway expression correlation.
a. Example of multiple metabolite annotations corresponding to a single m/z mass. For a given m/z mass, all corresponding pathways are mapped to each annotated metabolite. b. The expression of all pathways are calculated per spot/cell/pixel and correlated to the original intensity values of that m/z mass. Pathway expression may be calculated based on either only metabolites, only transcripts or a combined multi-omic score. Pearson correlation of the metabolites and the pathway scores across all spots in the tissue section was calculated. c. Based on the correlation score and the number of significant pathways (determined by a user set correlation threshold) a combined relevance score is calculated for each metabolite. This score represents a weighted combination of correlation to pathways and number of significant pathways. A one-sided heuristic p-value and adjusted p-value (Benjamini-Hochberg) is calculated to rank the most likely metabolites per m/z value. d. Using the function CalculateAnnotationStatistics each m/z value can be assigned a most-likely metabolite based on this method.
Extended Data Fig. 8 SpaMTP multi-modal spatial alignment and mapping pipeline.
a. Example of interactive Shinny app interface used for aligning spatial coordinates between spatial-omics datasets. b. Output of aligned SM and ST objects to spatial coordinates corresponding to the tissue H&E image. c. First step in multi-modal mapping of SM data (5–25 µm) to lower resolution ST spots (55 µm) by generating polygons for each pixel and spot. d. Representation of metabolite mapping to each ST spot. For each ST spot the overlapping area of each overlapping pixel is calculated, and for those matching the specified threshold, the respective pixel name is matched with the corresponding ST spot. For spots with multiple assigned pixels, the metabolite values are averaged. e. Representation of final aligned and mapped spatial multi-omics SpaMTP object, with each spot containing both metabolite and gene abundance/expression values. f. First step in multi-modal mapping of SM data to high resolution simulated ST single-cell data, by generating polygons for each pixel and cell. g. Mapping of each single-cell to a respective pixel based on the cell’s centroid location. h. Final multi-omics SpaMTP object containing simulated metabolite and transcriptomic information for each single cell.
Extended Data Fig. 9 Changes in clustering results based on differing modality weights.
a. Line graph representing changes in multi-omic clustering results based on altering the weighted-nearest neighbour weight of metabolic data from 0 to 1. These results are generated using PCA embedding calculated through Seurat’s default RunPCA function. b. These results are generated using PCA embedding calculated through SpaMTP’s GraphPCA functions. These graphs display changes in adjusted rand index (ARI) compared to the ground truth annotations displayed in c.
Extended Data Fig. 10 Benchmarking of runtime and computational resources.
a. Runtime and memory usage of SpaMTP’s annotation function (AnnotateSM) across different sized datasets (1,000–100,000 cells). b. Benchmarking results of running multi-omic cell/spot mapping between single cell resolution and spot based samples. c. Runtime and memory changes for MapSpatialOmics function across different numbers of metabolites for a single cell resolution spatial dataset. d. Line graph demonstrating the memory and runtime usage of clustering methods implemented in SpaMTP compared to Cardinal (SpatialShrunkenCentroid – SSC) using a public mouse liver dataset containing spotted chemical standards31. e. Spatial visualisation of clustering results compared to ground truth using Cardinal and SpaMTP implemented clustering methods. Arrows denote key biological regions of interest between each method for 18,750 cells (*) and 168,750 cells (#). f. Runtime and memory metrics for clustering large spatial datasets using data sketching methods at various dataset sketch sizes. Adjusted rand Index (ARI) scores were used to assess performance compared to the ground truth. g. Spatial visualisation of clustering results using sketching method.
Supplementary information
Supplementary Table 1: Benchmarking SpaMTP’s automated metabolite annotation against METASPACE results. Supplementary Table 2: Comparing SpaMTP automated metabolite annotation results to original publication annotations. Supplementary Table 3: Mouse urinary bladder differential metabolite expression results. Supplementary Table 4: Multimodal pathway analysis benchmarking.
Tables of data used to produce plots.
Rights and permissions
Open Access This article is licensed under a Creative Commons Attribution-NonCommercial-NoDerivatives 4.0 International License, which permits any non-commercial use, sharing, distribution and reproduction in any medium or format, as long as you give appropriate credit to the original author(s) and the source, provide a link to the Creative Commons licence, and indicate if you modified the licensed material. You do not have permission under this licence to share adapted material derived from this article or parts of it. The images or other third party material in this article are included in the article’s Creative Commons licence, unless indicated otherwise in a credit line to the material. If material is not included in the article’s Creative Commons licence and your intended use is not permitted by statutory regulation or exceeds the permitted use, you will need to obtain permission directly from the copyright holder. To view a copy of this licence, visit http://creativecommons.org/licenses/by-nc-nd/4.0/.
About this article
Cite this article
Causer, A., Lu, T., Kriel, J. et al. SpaMTP: integrative statistical analysis and visualization of spatial metabolomics and transcriptomics data.
Nat Methods (2026). https://doi.org/10.1038/s41592-026-03140-8
-
Version of record:31 July 2026
-
DOI
:https://doi.org/10.1038/s41592-026-03140-8
