

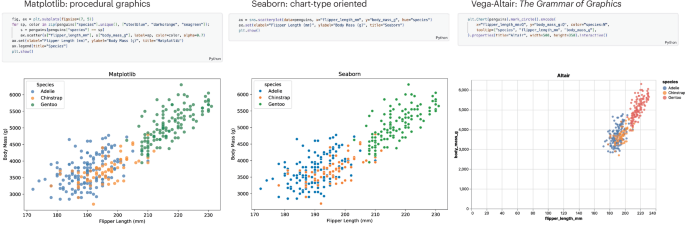
Biologists can reuse, remix and vibe code scientific figures.
This is a preview of subscription content, access
Access options
- Purchase on SpringerLink
- Instant access to the full article PDF.
Prices may be subject to local taxes which are calculated during checkout
References
-
Perkel, J. M. Nature640, 1116–1117 (2025).
-
Hunter, J. D. Comput. Sci. Engineer.9, 90–95 (2007).
-
Waskom, M. Seaborn: statistical data visualization. Zenodohttps://doi.org/10.5281/zenodo.4645478 (2021).
-
Wickham, H. Wiley Interdiscipl. Rev. Comput. Stat.3, 180–185 (2011).
-
Gu, Z., Eils, R. & Schlesner, M. Bioinformatics32, 2847–2849 (2016).
-
Wilkinson, L. The Grammar of Graphics (Springer, 2005).
-
Wilkinson, M. D. et al. Sci. Data3, 160018 (2016).
Acknowledgements
We thank S. Dagstuhl for hosting the Dagstuhl Seminar 26101, where we initially discussed this article.
Authors and Affiliations
Ethics declarations
Competing interests
The authors declare no competing interests
Rights and permissions
About this article
Cite this article
Lex, A., Jambor, H.K. Code to plot.
Nat Methods23, 1473–1474 (2026). https://doi.org/10.1038/s41592-026-03173-z
-
Version of record:06 August 2026
-
DOI
:https://doi.org/10.1038/s41592-026-03173-z
