

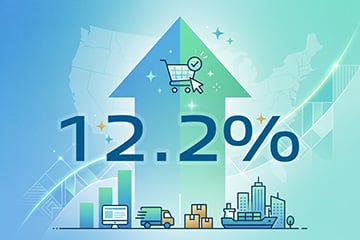
U.S. ecommerce sales enjoyed a second consecutive quarter of double-digit growth in 2026, resembling pre-pandemic patterns.
The U.S. Census Bureau reported last week that seasonally adjusted Q2 retail ecommerce sales were $340.2 billion, up 12.2% year over year, following Q1’s YoY increase of 10.1%.
| Quarter | Ecommerce Sales | QoQ Growth | YoY Growth |
|---|---|---|---|
| 2026 Q1 | $327.9B | 3.1% | 10.1% |
| 2026 Q2 | $340.2B | 3.8% | 12.2% |
For the first half of 2026, ecommerce sales totaled $668.1 billion, up 11.1% YoY.
Pandemic
The pandemic caused a major jump in consumers’ online purchases.
Reports of the first Covid cases in China occurred in late Q4 2019. U.S. retail ecommerce sales in that quarter grew 16.2% year over year, according to the Census Bureau.
As the virus spread and the United States restricted or shut down in-person sales, online shopping became the only option for many consumers.
U.S. ecommerce sales grew 53.5% YoY in Q2 2020 and over 40% YoY for the ensuing three quarters. Yet by Q2 2022, annual U.S. ecommerce growth had slowed to 5.1%.
| Quarter | Ecommerce Sales | QoQ Growth | YoY Growth |
|---|---|---|---|
| 2019 Q2 | $135.5B | 4.10% | 10.20% |
| 2019 Q3 | $144.1B | 6.30% | 14.60% |
| 2019 Q4 | $150.2B | 4.20% | 16.20% |
| 2020 Q1 | $156.9B | 4.40% | 20.50% |
| 2020 Q2 | $208.1B | 32.60% | 53.50% |
| 2020 Q3 | $212.4B | 2.00% | 47.30% |
| 2020 Q4 | $217.2B | 2.30% | 44.50% |
| 2021 Q1 | $227.9B | 5.00% | 45.30% |
| 2021 Q2 | $236.0B | 3.50% | 13.40% |
| 2021 Q3 | $232.2B | -1.60% | 9.30% |
| 2021 Q4 | $239.8B | 3.30% | 10.40% |
| 2022 Q1 | $244.0B | 1.70% | 7.00% |
| 2022 Q2 | $248.0B | 1.60% | 5.10% |
Acceleration
In 2025, online sales growth accelerated — 5.0% YoY in Q2, 5.3% in Q3, and 5.9% in Q4 — before reaching double digits this year.
| Quarter | Ecommerce Sales | QoQ Growth | YoY Growth |
|---|---|---|---|
| 2025 Q2 | $303.3B | 1.9% | 5.0% |
| 2025 Q3 | $310.8B | 2.5% | 5.3% |
| 2025 Q4 | $318.0B | 2.3% | 5.9% |
| 2026 Q1 | $327.9B | 3.1% | 10.1% |
| 2026 Q2 | $340.2B | 3.8% | 12.2% |
Ecommerce continued to outpace retail overall (online plus brick-and-mortar). Total U.S. retail sales increased 6.7% YoY in Q2 2026, about half the rate of ecommerce, while ecommerce’s share of retail rose to 17.1% from 16.3% a year earlier.
Together, the figures suggest an ecommerce market gaining momentum rather than benefiting from higher retail spending generally.
There are caveats. The Census Bureau’s figures are unadjusted for inflation, meaning higher prices account for some of the increase. And Amazon moved Prime Day into June this year, potentially shifting billions of dollars in ecommerce spending from the third quarter into the second.
Product Categories
Moreover, while ecommerce overall grew 12.2% YoY in Q2, performance varied among categories:
- General merchandise grew 21.6%.
- Sporting goods, hobby, books, and related products grew 20.4%.
- Food and beverage grew 8.1%.
- Health and personal care grew 9.3%
- Furniture and home furnishings grew 4.6%.
- Clothing and accessories grew just 3.8%
Businesses can differ from category averages in product mix, prices, marketplaces, geography, and customer segments.
Contribution
Moreover, a category’s growth rate doesn’t reflect its contribution to overall ecommerce growth.
“Clothing and accessories” grew only 3.8% YoY in Q2 2026, or $592 million. “Health and personal care” grew 9.3% — more than twice as fast — for just $220 million.
The same effect appears among larger categories, too. “General merchandise” grew 21.6% for roughly $8.3 billion in sales.
| Category | Q2 2025 Ecommerce | Q2 2026 Ecommerce | Growth | Added Sales |
|---|---|---|---|---|
| General merchandise | $38.5B | $46.9B | 21.60% | +$8.3B |
| Building materials & garden | $12.3B | $13.7B | 11.50% | +$1.4B |
| Food & beverage | $9.6B | $10.3B | 8.10% | +$775M |
| Sporting goods, hobby, books | $3.3B | $4.0B | 20.40% | +$673M |
| Clothing & accessories | $15.5B | $16.1B | 3.80% | +$592M |
| Health & personal care | $2.4B | $2.6B | 9.30% | +$220M |
Thus percentage growth differs from contribution.
A relatively slow-growing category may represent a large and expanding market, while a fast-growing category may add fewer actual sales dollars. Percentage growth provides context, but market size determines its impact.
What’s Next
The next few quarters will be telling. Does 2026 signal a lasting acceleration in U.S. ecommerce spending, or is it an outlier?
A healthier ecommerce market could justify additional investment in inventory, customer acquisition, technology, or fulfillment capacity.
But the data also suggests uneven economics among products, channels, and categories.
